Thursday, September 27, 2007

Market Sentiment Sees Jump In Investor Bullishness: 9.27.2007

Investor sentiment as surveyed by the American Association of Individual Investors reported a jump in investor bullishness for the period ending September 27, 2007. Investor bullishness increased to 49.37% versus last week's 39.24%. However, the 8-period moving average remains in a longer term downtrend as detailed on the chart below.

investor sentiment past results September 27, 2007
(click on graph for larger image)

investor sentiment graph 8-period moving average.September 27, 2007


Wednesday, September 26, 2007

Dogs Of The Dow Performance Update: 9.26.2007

The "Dogs of the Dow" investment strategy is one where an investor ranks the thirty Dow Jones Industrial Average members by yield, highest to lowest, based on the last trading day of the year values. An investor then invests an equal amount in the ten highest yielding Dow stocks and holds them for one year. More information on the Dogs of the Dow investment strategy can be found at a website devoted to Dogs of the Dow investing and other variations on the strategy.

Following is an update on the year to date performance of the Dow dogs as of September 26, 2007:

(click on table for larger image)


Sunday, September 23, 2007

Sector Performance In A Declining Fed Funds Rate Environment

If history is any guide, the recent Fed Funds rate cut will not be the only one in this cycle. Greg Donaldson of Donaldson Capital Management has further discussion on this point in a post titled, Stocks Twelve Months After A Rate Cut. In addition to additional rate cuts being anticipated, he notes "stocks" are generally 12% higher twelve months after the first rate cut. Certainly, all stocks will not be higher over this time period. Taking this one step further, one can look at the S&P 500 Index sector returns in different Fed Fund rate cycles.

Michael King and Scott Martin of the University of North Florida provide some research into market sector returns in a paper titled, Federal Funds Target Rate Changes and Sector Equity Returns (link to paper can be found at bottom of linked page). The study, published May 25, 2007, examines the return of the S&P 500 sectors for the period January 1, 1999 to May 11, 2005. This is a rather short time period; however, it does capture market action during a point in time when the Fed was announcing its policy actions immediately following a Fed meeting. Prior to 1994 the FOMC meeting results were made public 45-days following the FOMC meeting.

During the time period noted above, the FOMC met 54 times. Subsequent to the meetings, the following Fed actions were taken:
  • 14 rate increase.
  • 13 rate decrease.
  • 27 no change in rate.
If reviewing the sector performance in both increasing and decreasing rate environments, the research concluded:
  • on average, in a decreasing Fed Funds rate cycle, Consumer Discretionary, Technology, Materials, Health care and Financial sectors increased in value. The other sectors, Consumer Staples, Utilities, Energy and Industrials declined in value.
The research also looked at sector performance separately for increasing rate cycles and decreasing rate cycles. The table below summarizes some of the sector return data from the research. In order to read the table:
  • In the "all cycles" column, for a 100 basis point (one full percentage point) decrease in the Fed Funds rate, consumer discretionary stocks rose 1.169%.
  • In the "increasing rate cycle" column, for a 100 basis point increase in the Fed Funds rate, consumer discretionary stocks decline .446%
  • In the "decreasing rate cycle" column, for a 100 basis point decrease in the Fed Funds rate, consumer discretionary stocks rose 1.49%.
(click on table for larger image)

sector perforance in various fed rate cycles

The one surprising sector is the performance of utility stocks in a decreasing Fed Funds rate cycle. The research noted that utility stocks actually declined 1.454% for a 100 basis point decrease in the Fed Funds rate. This may be a result of the fact that the Fed cuts have generally come late in an economic cycle and take 6-9 months to have an economic impact. Consequently, the growth in utility earnings may slow early in the rate cut cylce as the economy tends to be slowing before the Fed does cut rates.


Dividend Aristocrats Furthest Below 52-Week High

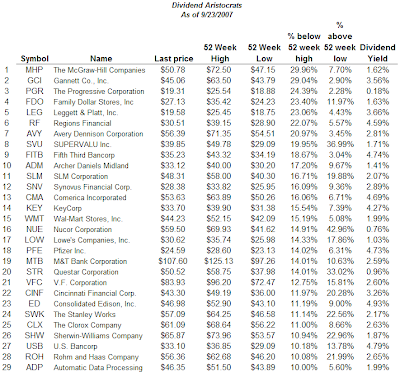
Following is a list of the dividend Aristocrats that are trading 10% or more below the stock's 52-week high. Out of the 58 dividend aristocrat stocks, 29 are trading more than 10% below the stock's 52-week high.

(click on table for larger image)

dividend aristocrats below 52 week high September 21, 2007


Friday, September 21, 2007

Dividend Aristocrats Generally Keep Pace With Market: Week Ending 9.21.2007

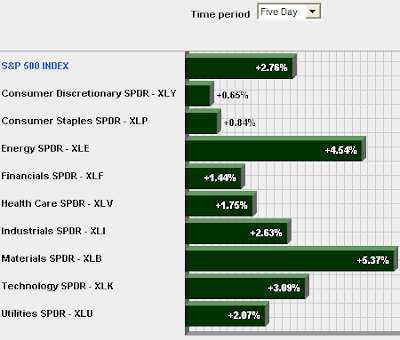
Certainly an interesting week with the Fed lowering both the Fed Funds Rate and the Discount Rate by 50 basis points on Tuesday. The Fed's action added fuel to the fire and propelled the market higher on the week. Standard & Poor's Dividend Aristocrats generally kept pace with the market on the week.


S&P dividend aristocrats performance summary. Week ending September 21, 2007
The weakest performing Aristocrats tended to fall into the financial and discretionary sectors. The defensive sectors: staples, health care and financials did underperform the overall market.

(click on table for larger image)

dividend aristocrats performance summary September 21, 2007
sector performance S&P 500 index week ending September 21, 2007


Thursday, September 20, 2007

Market Sentiment: Bears Less Bearish

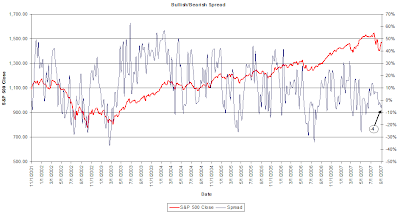
In yesterday's investor sentiment release by the American Association of Individual Investors, the level of bullishness ticked fractionally lower to 39.24% versus last week's 40.00%. The level of bearishness, however, declined to 31.65% versus last week's 35.29%. The prior week's bears moved more towards a neutral stance. The net result is the bull minus bear spread moved higher to +8 versus last week's +5.

(click on chart for larger image)

investor sentiment bull bear spread September 20, 2007


Tuesday, September 18, 2007

Stock Buybacks Accelerate In Second Quarter 2007

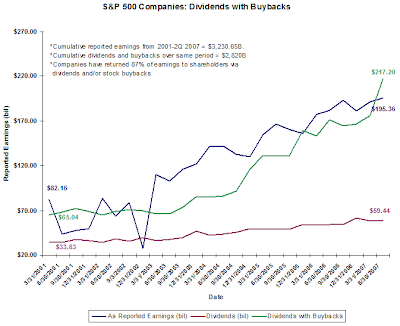
In the 2nd quarter of 2007 Standard & Poor's reports stock buyback activity continues at a record pace. As noted in the chart below, the combined amount of buybacks plus dividends exceeded reported earnings in the quarter. Howard Silverblatt, Senior Index Analyst at Standard & Poor's notes:
  • The record buyback activity was fueled by IBM’s landmark $15.7 billion stock buyback during the second quarter.
  • Large quarterly buybacks were also reported by Exxon Mobil at $7.6 billion and Microsoft at $7.2 billion.
  • Over the past eleven quarters, when the buyback bonanza started, S&P 500 issues have spent approximately $1.12 trillion on stock buybacks compared to (a similar) $1.24 trillion on Capital Expenditures and $594 billion on dividends.
  • Standard & Poor’s also notes that the top-ten buyback issues accounted for 35% of all stock buybacks during the quarter with an aggregate amount of over $54 billion.
(click on chart for larger image)

stock buyback chart S&P 500 Index second quarter 2007
Source:
S&P 500 2nd Quarter Buyback Activity Sets Record at $158 Billion
Standard & Poor's
By: David R. Guarino & Howard Silverblatt
September 6, 2007
http://www2.standardandpoors.com/portal/site/sp/en/us/page.article/2,3,2,2,1148434843833.html


Saturday, September 15, 2007

Individual Investors Less Bearish

This week the American Association of Individual Investors reported individual investor bullishness increased to 40.00% versus last week's 38.38%. The bearishness level fell by a larger amount with a large part of those surveyed moving to a more neutral stance. This caused the bullish minus bearish level to rise to a +5 versus last week's -4.

(click on chart for larger image)


Thursday, September 13, 2007

Microsoft and Harley Davidson Announce Dividend Increases

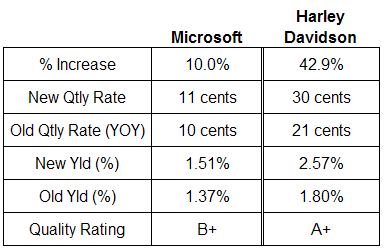
Microsoft (MSFT) and Harley Davidson (HOG) both announced dividend increases today.

Microsoft announced a 10% increase in their quarterly dividend. The quarterly dividend increases to 11 cents per share versus 10 cents per share in the same quarter last year. The estimated payout ratio will equal 25% based on June 2008 estimated earnings of $1.73. The 5-year average payout ratio is approximately 23% excluding the $3.00 special dividend in 2005.

Harley Davidson announced a 42.9% year over year dividend increase. The new quarterly dividend increases to 30 cents per share versus 21 cents per share in the same quarter last year. The company did increases its quarterly dividend in the 2nd quarter this year to 25 cents per share. The estimated payout ratio will equal 31% based on estimated 2008 earnings of $3.88. The 5-year average payout ratio is approximately 13%. The payout ratio in 2002 equaled 7%.
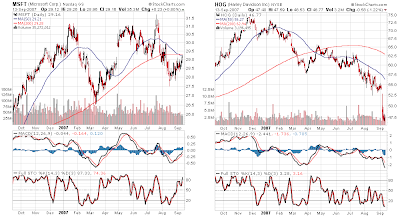
(click on table/chart for larger image)

Microsft and Harley Davidson dividend table
Microsft and Harley Davidson stock chart


Wednesday, September 12, 2007

McDonalds Corp. Raises Dividend 50%

After the market close, McDonalds Corp. (MCD) announced a 50% increase in the company's annual dividend. The new annual dividend will be $1.50 versus $1.00 last year. The company pays one dividend during the year in December. The ex-date will be around November 13, 2007.

  • The 5-year historical payout ratio is approximately 34%.
  • The estimated payout ratio on estimated 2007 earnings of $2.85 is approximately 53%. Estimated earnings for 2008 are $3.03.
  • The company carries an S&P Quality Ranking of A.
(click on table/chart for larger image)


Saturday, September 08, 2007

Buybacks To Replace Dividend Payments?

In a recent research report by Douglas J. Skinner titled, "The Evolving Relation between Earnings, Dividends, and Stock Repurchases," Skinner concludes there may come a time when dividends completely disappear. From a contrarian perspective, I hope this research report is one indication dividends will become more important in an investor's mind. His report notes dividends are based on earnings; therefore, using a dividend growth approach as a measure to evaluate a company's future growth prospects is beneficial. On the other hand, the report notes buybacks are gaining in popularity and evaluating buyback activity for a firm may be another approach of choice going forward.

I do believe buyback activity can be a useful metric to use in evaluating the prospective growth of a company's future earnings. The risk is buybacks are not a long term commitment by a company to return capital to shareholders. Dividends are more of a longer term commitment as companies know the market penalizes its stock price if dividends are reduced or eliminated.

Some facts Skinner details in his research report:
  • Skinner shows that the increased volatility of earnings helps explain changes in payout policy over the last 30 years.
  • First, Skinner shows that since 1980 there have been three main groups of payers: 1) established firms that have always paid dividends and now also make repurchases on a regular basis; 2) firms that make regular repurchases but do not pay dividends; and 3) firms that make occasional repurchases.
  • Skinner finds that firms in the first group have been paying dividends for decades and continue to do so largely because of their dividend history. Over time, managers of these firms increasingly use repurchases to pay out earnings increases, with dividend policy becoming more conservative. This suggests the reluctance to reduce or omit dividends has become stronger in recent years (emphasis added). Skinner also finds that these firms dominate the set of publicly held firms, accounting for more than half of all total earnings and payouts.
  • Dividend policies are incredibly sticky once firms have established a dividend amount, they feel as if they have to maintain that level of dividend going forward.
One of the important points from the study is:
  • ...prior research has shown that managers set dividends based on current and past earnings.
The above point is a strong reason why an investor can use a firm's dividend policy and practices to assist in projecting future earnings prospects.

From a historical perspective, aggregate buyback amounts now exceed aggregate dividend payments. I noted this in an earlier post, Stock Buybacks Continue At A High Level.

From a cautionary standpoint, Skinner finds, "those firms that both pay dividends and make repurchases have a conservative dividend policy and use repurchases to supplement dividends in years with strong earnings." The issue here is the buybacks are based on past earnings and cash flow results and not on a company's expectations of future earnings prospects.

When evaluating dividend growth aspects of a firm, the growth rate of a dividend is an indication of a company's future earnings growth prospects. This was detailed in a study by Robert Arnott and Clifford Asness titled, Surprise! Higher Dividends = Higher Earnings Growth (pdf).

Source:
The Dividend Puzzle
Capital Ideas
By: Douglas J. Skinner
August 2007
http://www.chicagogsb.edu/capideas/aug07/4.aspx

The Evolving Relation between Earnings, Dividends, and Stock Repurchases
Social Science Research Network
By: Douglas J. Skinner
May 2006
http://papers.ssrn.com/sol3/papers.cfm?abstract_id=906853#PaperDownload

Buyback vs. Payout($)
Barron's
By: Shirley A. Lazo
September 10, 2007
http://online.barrons.com/article/SB118920653164721130.html?mod=9_0031_b_this_weeks_magazine_columns


Friday, September 07, 2007

Second Half Of September The Weakest

An interesting chart provided by Chart of the Day notes the Dow Jones Industrial Average's average performance by day during the month of September. As displayed in the chart below, the second half of September tends to be the weakest part of the month.

(click on chart for larger image)


Thursday, September 06, 2007

Dividend Payers versus Non Payers Performance: August 31, 2007

For the period ending August 31, 2007, the non dividend payers in the S&P 500 Index outperformed the payers for both the year to date time period and 12-month period. A large part of the dividend payer underperformance is attributable to the underperformance of financial holdings due to the subprime issues that impacted the market in August.

(click on table for larger image)

dividend payers versus non payers in S& 500 Index August 31, 2007


Bullish Sentiment Declines But Not The Bull/Bear Spread

Bullish investor sentiment declined to 38.38% versus last week's level of 40.30%. The spread between bullishness and bearishness actually improved to -4% versus last week's -6%. This was due to the level of bearishness improving to 42.42% versus 46.27% last week. Recall, the investor sentiment indicator is a contrarian one.

(click on graph for larger image)

investor sentiment. September 6, 2007


Wednesday, September 05, 2007

S&P 500 Index In An Uptrend?

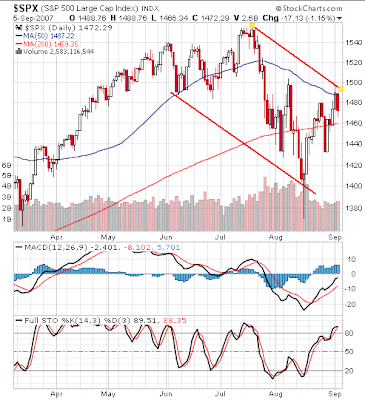
They say a picture is worth a thousand words. The question is which picture is the correct one. From a technical perspective, the two charts below depict the S&P 500 Index with different reference points for the trend lines.

In the first chart, it appears the S&P Index may be breaking out of a short term downtrend. In the second chart, the downtrend remains firmly in tact. In both charts, two points should be considered:
  • the recent rally has been occurring on lower volume.
  • the S&P close today was below the 50-day moving average.
(click on charts for larger image)

s&p 500 index chart September 5, 2007
s&p 500 Index chart. September 5, 2007. Longer technical lines.
It appears the stock market is trying to establish an uptrend, but the lower volume and the inability of the index to hold the 50-day moving average resistance line is one indication the market (i.e., investors) is not firm in another leg up at the moment. If the market could establish several closes above the 50-day moving average, this could be a positive technical sign for the market.

As noted in one of my prior posts, Patience is a Virtue at this Point in the Cycle, there are a number issues the market needs to digest over the course of the next month or so that could determine the future direction of this market.


Tuesday, September 04, 2007

S&P 500 Index: August Summary Of Dividend Changes

All the dividend changes in August for companies in the S&P 500 Index were increases. Following is detail on the changes by company and the respective increase.

(click on table for larger image)


Sunday, September 02, 2007

Insider Trading Activity By Sector

As noted in my prior post, Defensive Sectors Hold Up Well In August, the worst performing sector year-to-date is the financial sector. Interestingly, the financial sector is seeing the largest activity in insider buying.

(click on table for larger image)


Defensive Sectors Hold Up Well In August

For the month of August, several of the defensive sectors in the S&P 500 Index held up fairly well relative to the performance of the overall index.

(click on table for larger image)

  • The sectors showing the best return for August were Information Technology, Consumer Staples, Health Care and Utilities.
  • Total Return for the S&P 500 Index includes the dividends.
  • Net Total Return is reinvestment of the dividend excluding estimated withholding taxes.