Tuesday, September 30, 2008

Dividend Aristocrats Outperform In September

September lived up to its reputation for being the worst performing month for the stock market. It seemed an equity investor had no place to hide. On the other hand, Standard & Poor's Dividend Aristocrats held up fairly well for the month.

Preliminarily, the 4-week return for the Aristocrats equaled -4.4% versus a return of -5.8% for the Dow Jones Industrial Average and -8.8% for the S&P 500 Index. On a year to date basis, the Aristocrats returned -8.2% versus the Dow return of -18.2% and the S&p 500 return of -20.7%. The below spreadsheet details the return of the Aristocrats. The complete spreadsheet can be accessed at this link.


The gloom and doom displayed in the market yesterday was nearly reversed today. Maybe a bailout package in the form presented Monday is not needed. It seems regulators may be addressing some regulatory issues that seem to be contributing to the market stress, one being FAS 157 (mark to market accounting). Additionally, the FDIC is looking at increasing insurance limits on bank deposits. I think the point of all this is we do not need to rush a bad piece of legislation through Congress. Some type of additional monetary support is likely needed from the government, but let's not allow the government to gain ownership of public companies.


Monday, September 29, 2008

Not The Worst One Day Decline

Commentators and talking heads of the media would have an investor believe that the 777 point decline in the Dow Jones Industrial Average was the worst one day decline on record. Well, today's decline barely cracks the top ten on a percentage basis.


Even before the House vote failure on the bailout package, the market was skeptical of this package. The Dow was down + or - 300 points before the vote results. The key here is to get a Congressional package that is the right one. The web is flush with commentary on the package so I will not restate them here.

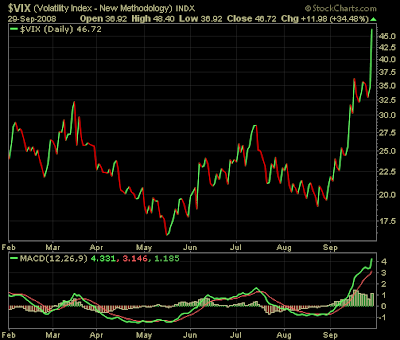
From a technical market perspective, we are finally seeing fear in the streets. The VIX has jumped to 46. The percentage of S&P 500 stocks trading above their 50 and 150 day moving averages have reached extreme oversold levels.

(click on charts for larger image)

VIX Index September 29, 2008
percentage of S&P 500 stocks trading above 50 day and 150 day moving averages
There is money to be made in this market when it turns. Investors should take this opportunity to not react hastily, but remain disciplined in their stock selection choices.


Sunday, September 28, 2008

Finding Value In The Financial Sector

It goes without saying that the stocks in the financial sector have seen their fair share of difficulties. At some point, bargains will certainly surface in this sector as beaten down stocks provide investors with attractive purchase entry points.

As an investor, one will want to analyze these investment opportunities in order to determine the attractiveness of these investments. Following are some of the key metrics one should review when analyzing financial firms.

Profitability Ratios

* Return on Assets (ROA):
  • ROA = Net Income ÷ Total Assets
  • ROAs of 1% or greater are considered strong.
* Return on Equity (ROE)
  • ROE = Net Income ÷ Shareholder’s Equity
  • ROEs of 12% or higher are considered good.
* Net Interest Margin (NIM)
  • NIM = Net Interest Income ÷ Average Earnings Assets
  • Higher margins are better; margins above 4% for banks and above 3% for thrifts are impressive.
* Fee Income/Average Assets
  • Fee income is less volatile than net interest income, and is highly prized.
* Efficiency Ratio (ER)
  • ER = Non-Interest Expense ÷ (Net Interest Income + Fee Income)
  • Lower ratios are usually better, but reducing expenses too much might cause service to slip. An ER below 50% is very good.
Loan Quality Ratios

* Loan Loss Reserves to Total Loans
  • Loss reserves are found on the balance sheet as a reduction of gross loans (gross loans – reserve = net loans).
  • Ratio should be 1.3% or higher.
* Non-Performing Assets/Total Loans
  • Non-performing assets are non-performing loans plus other real estate owned.
  • Provides an indication of how much of the loan portfolio might be impaired; should be as low as possible (greater than 4% to 5% isn’t good, and above 8% to 10% can be life threatening).
* Loan Loss Provision/Net Charge-Offs
  • Loan loss provisions should be at least 100% of the net charge-offs.
  • Loan loss provisions consistently exceeding net charge-offs is very conservative.
* Loan Loss Reserve/Non-Performing Assets
  • Should be at least 100% (the value of every bad asset is covered by a reserve); higher is always better. But a lower ratio is not bad if bank’s management has good workout-teams capable of collecting on non-performers.
Capital Ratios

* Common Equity/Total Assets
  • The key capital ratio, and it should be at least 8% or better.
Non-Qualitative Factors
  • Insider ownership and insider buying: The more insider ownership, the better; insider buying is bullish.
  • Acquirer or acquiree? You can make money with either a well-managed growth-by-acquisition strategy, or a strategy of investing in small well-run banks likely to be acquired.
  • Deposit growth: 8% to 10% annually is good.
  • Dividend payout ratio: Many banks offer attractive yields, but if dividends per share consistently exceed earnings per share, a dividend cut may be coming.
By utilizing the above metrics to evaluate financial firms, one may uncover some attractive investment opportunities in this beaten down sector.

Source:

Money in the Bank: How to Find Opportunities in a Fallen Sector (PDF)
AAII Journal
By: John Deysher, CFA
Pinnacle Value Fund
July 2008
http://www.pinnaclevaluefund.com/reports/AAII_JulyStockStrategies.pdf


Saturday, September 27, 2008

Insight During This Period Of Market Turmoil

Much has occurred in the market this year. Of late we have seen the demise of Lehman Brothers (LEHMQ), Washington Mutual (WM), Merrill Lynch (MER) and the distress at American International Group (AIG). What is an investor to do during this time in order to make sense of the situation.

Charles Schwab (SCHW) has dedicated an entire article, How the Turmoil on Wall Street May Affect You, on this topic. Some of the issues contained in the article are:
  • What does it mean that Morgan Stanley and Goldman Sachs are now bank holding companies.
  • What to do if you own common or preferred shares of AIG.
  • Topics on Neuberger Berman.
  • Is the banking system holding up?
  • Are my assets safe at traditional banks.
Many more topics are covered that one might find of interest.

Source:

How the Turmoil on Wall Street May Affect You
Charles Schwab
By: Mark W. Riepe, CFA
September 26, 2008
http://www.schwab.com/public/schwab/research_strategies/market_insight/todays_market/recent_commentary/wall_street_crisis_and_you.html


Thursday, September 25, 2008

McDonalds Increases Dividend 33.3%

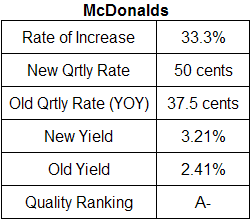
Today, McDonalds Corp. (MCD) announced a 33.33% YOY increase in the company's quarterly cash dividend. The new quarterly dividend increases to 50 cents per share versus an equivalent 37.5 cents per share paid in the 4th quarter last year. It should be noted that prior to 2008, MCD paid one annual dividend. In 2007 the annual dividend was $1.50. The projected payout ratio is approximately 53% based on 2009 estimated earnings of $3.81. The 5-year historical payout ratio is approximately 44%.

(click on table/chart for larger image)

McDonalds dividend analysis table September 2008
McDonalds stock chart September 2008


Wednesday, September 24, 2008

Positive Economic Data For A Change

I am not sure the rhetoric surrounding the economy and financial markets can get any more negative than they are at the moment. It seems as though every talking head is piling on about the negative reverberations impacting markets and the economy. Even Jack Welch told the World Business Forum, "I now believe we are in for one hell of a deep downturn" and also stating the first quarter of 2009 will likely be "brutal." (courtesy of Reuters). Historically the news gets the most negative at market bottoms.

As I noted in a post on The DIV-Net site titled, Should You Stick With Stocks, Warren Buffett has an investment saying:
"I will tell you how to become rich. … Be fearful when others are greedy. Be greedy when others are fearful."
So what do we hear Warren Buffett did last night/today: invested $5 billion in Goldman Sachs.

There are some positive economic data points in place at the moment. The Philadelphia Fed's Business Outlook Survey for September notes:
  • The region’s manufacturing sector showed some signs of improvement this month, according to firms polled for the September Business Outlook Survey.
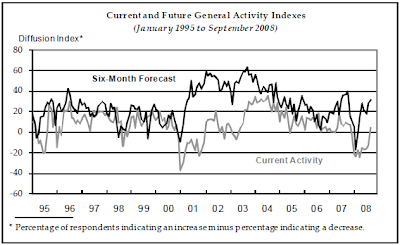
  • The survey’s broadest measure of manufacturing conditions, the diffusion index of current activity, increased from ‐12.7 in August to 3.8 this month (see chart below). This is the first positive reading for the index since last November.
  • Demand for manufactured goods, as represented by the survey’s new orders index, improved significantly, increasing 18 points, to a positive reading of 5.6.
(click on chart for larger image)


Additionally, the latest inventory to sales data (July 2008) notes historically low inventory levels relative to sales. When the economy picks up, the low level of inventory will necessitate a fairly quick increase in manufacturing in order to fill sales orders.

(click on chart for larger image)


Certainly, the Wall Street financial stress is problematic. I will be the first to admit, I wish the government did not need to provide a financial backstop to clear the current credit mess. However, I do not think we have a choice, and Congress knows it, so some plan will likely be passed. Let's only hope the government does not overplay its hand in gaining control of companies; thus, inhibiting the free market capitalistic system. Sure, regularity oversight, or lack there of, needs to be evaluated. Keep in mind it was the government that had sole oversight over Fannie and Freddie and what a mess that turned out to be.

In the end, there are some positive economic factors in place that could allow for a reasonable recovery with the passage of the bailout plan. Warren Buffett certainly sees there is a very high likelihood a plan gets passed soon. And what is Mr. Buffett doing? He is investing in this market.


Tuesday, September 23, 2008

Microsoft Increases Quarterly Dividend By 18%

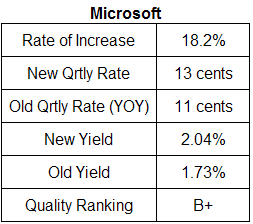
On Monday, Microsoft (MSFT) announced it will increase the company's quarterly dividend by 18.18%. The new quarterly dividend will equal 13 cents per share versus 11 cents per share in the same quarter last year. In addition to the dividend increase, the company announced a $40 billion stock buyback program. It should be noted though the buyback program runs through September 30, 2013. The projected payout ratio is 24% versus 20% on the prior dividend rate of 44 cents. The payout estimate is based on the projected June 2009 earnings estimate of $2.15.

(click on table/chart for larger image)

Microsoft dividend analysis table
Microsoft stock chart September 23, 2008


Monday, September 22, 2008

Investing Carnival #14

The state of the market seems to have dictated many of the topics in this week's carnival. As the below posts note, many provide advice on how to handle this market volatility.

DIVIDEND INVESTING

The Dividend Guy Blog notes "there are 4 crucial factors a dividend investor must consider," in the post The Four Most Important Metrics When Evaluating Dividend Stocks.

STOCK ANALYSIS

Dividends 4 Life presents Stock Analysis: Pitney Bowes Inc. (PBI) noting, "Pitney Bowes Inc. is the world's largest maker of mailing systems, also provides production and document management equipment and facilities management services. Linked here is a detailed stock analysis and commentary."

Central Europe & Russia Fund Inc. (CEE) Analysis - Revisited posted at One Family's Blog, notes, "An analysis of CEE, a closed-end exchange traded fund (ETF) focused on Central Europe & Russia trading at a double-digit discount to NAV."

INVESTING

Your Finish Rich Plan presents Understanding Stock Market Volatility: Perception vs. Reality noting, "The stock market can be very volatile in the short-run, but when considering longer time frames, it's not nearly as volatile and is actually quite predictable"

Triaging My Way To Financial Success presents Capitulation Chaos: advising there is "A valuable insight into how to best position yourself for market volatility from a fellow value and dividend investor"

Invest In India presents Are you disappointed with your mutual fund investments? noting "2008 has been tough on investors. This holds especially true for first-time investors. After having seen the markets surge to record highs, the downturn has certainly caught several investors off-guard."

MagicDiligence - Optimizing Joel Greenblatts Value Stock Strategy notes in the post, The Problem with Investing in Banks, that "Magic Formula investors have luckily been spared from the calamity in financial stocks over the past year. But even in the best of times, banking is a risky industry that is difficult to properly value, and should be avoided by most individual investors."

FIRE Finance writes about some of the risk factors that impact the market in the post, Investment Risks at a Glance.

The Financial Blogger notes in the post, Is the apocalypse among us?, that "The US market is going down and major companies are following the trend. What is going on?"

The Simple Dollar's post Using TreasuryDirect for Conservative Investing provides, "A basic description of how TreasuryDirect works and what you can invest in there."

The Iconoclast Investor offers insight into the recent market volatility, 10 Observations About This Financial Storm.

My Simple Trading System blog highlights two emotional factors that influence investors at the post, Lehman, Merril Lynch, and AIG Lead to The "Unbubble".

In Trader's Narrative's post, TED Spread: Going Where No Spread Has Gone Before it is noted, "The TED spread is one of the most basic gauges of fear in the financial markets. TED stands for Treasury Eurodollar because originally it was calculated by taking the US 3 month treasury bill and subtracting it by the 3 month Eurodollar contract rate. Today the spread is calculated by taking the difference between the 3 month US T-bill rate and the 3 month LIBOR rate."

The Digerati Life's post provides insight on "What should an investor do during a turbulent stock market period?" at Best Places For Your Money When The Stock Market Tanks

How to Protect Yourself Against the Economic Crisis posted at The Smarter Wallet, provides some timely investment advice during this volatile market period.

Doing Nothing Can Be a Strategic Response to a Market Crash posted at Tough Money Love » Hard Truth and Tough Love for Money Problems and Personal Finance, saying, "When the market is in crisis, doing nothing can be a strategic response"

Some books and DVDs for a tough market at Gift Ideas for Stock Market Junkies posted at The Investor's Journal

VALUE INVESTING

Barel Karsan writes about the Canadian furniture manufacturer Amisco and its cheap price to book ratio in the post, Amisco: Liquidation Value.

WEALTH ACCUMULATION

Investment Internals notes at the post, Money lessons to kid, that one should "teach your kid about money and how to deal with money at various ages and let them achieve financial wisdom when they start earning."

ALTERNATIVE INVESTMENTS

Passive Family Income provides a review of covered call transactions at Wachovia Covered Call Contracts.

REAL ESTATE

Is It Possible that Housing Prices May Not Stabilize Until 2014? posted at Fiscal Zen.


That concludes the fourteenth carnival edition. Submit your blog article to the next edition of Investing Carnival using our carnival submission form. Past posts and future hosts can be found on The DIV-Net's blog carnival index page.


Thursday, September 18, 2008

Index Changes: S&P and the Dow Jones Industrial Average

The market volatility has claimed a few firms. The result is several of the large cap indexes will be making changes in the composition of their holdings.

The S&P 500 Index

(click table for larger image)

Dow Jones Industrial Average

Kraft Foods Inc. (KFT) will replace American International Group Inc. (AIG) in the Dow Jones Industrial Average, effective with the opening of trading on September 22, Dow Jones & Company announced.


Wednesday, September 17, 2008

The Market Is Trying To Find Firmer Footing

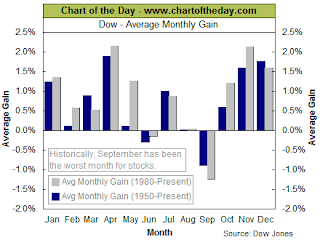
The market continues to struggle to find a firmer footing. As the below chart notes, September is living up to its place as the worst performing month for the market.

(click on chart for larger image)


The situation at the moment is very fluid. The Federal Reserve seems to be sending a strong message that they will not bail out every mistake or financial institution ( Lehman). To have two of the oldest and most respected names on Wall Street (Lehman and Merrill) meet their demise in one day earlier this week and the government's infusion of funds ($85 billion) into the largest insurance company in the world (AIG) today certainly makes one take pause.

While one can argue with some of the logic and tactics from the government, there are some smart people working through these financial issues. The Federal Reserve has injected liquidity into the financial system--the most since 9/11/2001. The Fed's primary role is financial system stability. They will work to provide sufficient liquidity to work through this distress. Excessive leverage and financial engineering with real estate assets has created much of the problem. In addition, the advent of "mark to market" accounting has created short term pressure for financial companies that has exacerbated the situation. Although regulation can sometimes cause unintended consequences, it is clear that smart regulation is necessary to keep up with fast moving financial engineering. Most of the problems we are facing at the moment are almost entirely credit related.

Many have said these are unprecedented times. On the one hand, I would agree that the issues impacting financial firms seem unprecedented. On the other though, it wasn't too long ago that we experienced the technology bubble. During the deflating of the tech bubble, the Dow retraced nearly 40% of its value from 2000 to 2002. From a year ago, the Dow Jones Industrial Average is down 20%. I am unable to predict the future, but I do believe famed investor Warren Buffet might have said it best:

"I will tell you how to become rich. … Be fearful when others are greedy. Be greedy when others are fearful."-- Warren Buffett

Historically, many of these types of declines have proved to be great long term buying opportunities. Maintaining an overall philosophy of owning high quality companies and fixed income investments serves one well during difficult times. It is always important to maintain a disciplined investment approach during these times.


No Power

For the next week or so, I will be posting sporadically. Our community, Ohio, was hit by remnants of Hurricane Ike on Sunday and was hit by an extended period of tropical storm force winds. As of tonight, over 200,000 homes are still without power. I am not complaining as it could certainly be worse.


Photos: Courtesy of the Cincinnati Enquirer


Sunday, September 14, 2008

Some Dividend Investment Opportunities

(I originally posted the following article on The-DIV-Net website on September 7, 2008)

The September issue of Argus Research's Argus Update newsletter provides a list of stocks the firm titles as Dialing for Dividends. The screen is based on the following criteria:

  • A market value of at least $1 billion
  • A dividend yield of at least 3%, but less than 6%
  • A dividend payout ratio of less than 50%
  • Dividend growth of at least 8% per year over five years
  • A forward P/E of less than 15
(click on table for larger image)

argus dividend screen September 2008
As is always the case, the list is only a starting point for investors. If any of the stocks on the list are being considered for inclusion in ones portfolio, additional research should be performed.

Source:

Dialing for Dividends: Stocks for Income & Safety ($)
Argus Update
September 2008
http://www.argusresearch.com/


Saturday, September 13, 2008

Don't Overlook Mid Cap Dividend Paying Stocks

One area of the market investors can find dividend paying stock opportunities is in the midcap value universe. Standard & Poor's notes:
"As a whole, the Standard & Poor’s MidCap 400 index boasts a dividend yield of 1.5%. But when the index is divided into growth and value stocks, the value stocks’ average yield is 2.7%, higher than the yield on growth stocks (0.8%)."
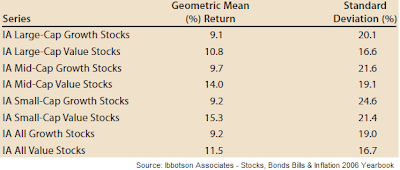
Often times this area is overlooked due to concerns about the increased volatility of this space versus large cap stocks. However, if one looks at the return relative to the volatility, midcap value stocks come out on top from a risk return standpoint. As the two tables below show, midcap value stocks actually exhibit lower volatility than a number of the other asset classes. At the same time, the historical returns are the highest except for small cap value stocks. The second table then details the return divided by the risk, resulting in the midcap value universe generating the highest return per unit of risk.

(click on tables for larger image)

risk and return for stock styles Ibbotson
risk adjusted stock return table IbbotsonStandard & Poor's publishes a list of Global Challengers that consist of domestic and international midcap stocks. The stocks on the list generally have a market capitalization from $1 billion to $5 billion. The global challengers list (PDF) details 300 companies from 33 countries across nine economic sectors. The list is generated based on the following attributes.
  • share price appreciation
  • sales growth
  • earnings growth
  • employee growth
The one factor not used in constructing the list is a dividend attribute. However, investors doing their own research can review the dividend characteristics on their own. Sam Stoval of S&P noted in June.
"Mid-cap stocks have less exposure to subprime mortgages, and many of them are initiating or adding to dividends—even as some large-cap stocks cut their dividend payments."

Source:

Galileo's View (PDF)
Touchstone Investments
Prepared by: Clover Capital Management, Inc.
January, 2007
https://www.touchstoneinvestments.com/shared/formslit/pdf/TSF1184.pdf

The Cream of the Mid-Cap Crop
BusinessWeek
By: Beth Piskora
June 5, 2008
http://www.businessweek.com/investor/content/jun2008/pi2008064_825583.htm

Stocks: Nine Up-and-Coming Mid-Caps
BusinessWeek
By: Beth Piskora
August 15, 2008
http://www.businessweek.com/investor/content/aug2008/pi20080814_865704.htm

Mid-Cap Value Funds ($)
The Outlook
By: Beth Piskora
September 17, 2008
http://www.outlook.standardandpoors.com/NASApp/NetAdvantage/servlet/login?url=/NASApp/NetAdvantage/index.do


Friday, September 12, 2008

Weekend Links: September 12, 2008

  • Use The Rule of 72 to estimate how long it takes to double your money.


Thursday, September 11, 2008

Dividend Aristocrat Synovus Slashes Dividend

Yesterday, Synovus (SNV) announced it would cut its quarterly dividend by nearly 65% to 6 cents per share. The prior quarterly dividend equaled 17 cents per share.

CEO Richard Anthony noted, capital preservation is a key concern as the bank faces ongoing credit concerns and uncertainties in this economic climate. “We believe the stress on our loan portfolio will continue through at least 2009, and we believe the net charge-off ratio throughout that period will remain in the 1% range.”

(click on chart for larger image)

Synovus stock chart September 11, 2008


Bullish Sentiment Declines: Approaching Prior Market Turning Points

Individual investor bullish sentiment fell to below 30% this week. This level is approaching levels seen at prior market turning points. Additionally, the bearish sentiment reading came in at 54.88% versus last week's 43.21%. These sentiment levels saw the bull/bear spread become more negative at minus 26% versus last week's level of minus 6%.

(click on graph for larger image)


Wednesday, September 10, 2008

Understanding The P/E Ratio

Many analyst and investors use the P/E or Price Earnings Ratio in the valuation of stock investments. Believe it or not, there are at least seven different forms of the P/E. P/E is certainly an important measure to review, but I do believe cash flow measures are equally important, if not more important. I have written several earlier posts on why cash flow and its the various ratios can be more useful. One such post titled, The Importance of Understanding the Difference between Earnings, Operating Cash Flow and EBITDA, will provide some detail behind the differences between cash flow and earnings type data. However, since the P/E ratio receives a lot of attention, having a greater understanding of this ratio could enhance ones analysis skills.

A recent article by the American Association of Individual Investors, Will the Real P/E Please Stand Up?, describes the different P/E calculations. Additionally, the article provides information on how these different P/E ratios are interpreted. Before reading the article at the link at the bottom of this post, reviewing the definitions of the various forms of P/E might be benefical.

(click on table for larger image)

different forms of the price earnings ratio or P/EI can't think of one single variable that can be used successfully in determining whether a stock is a good investment or not. Therefore, one should incorporate these P/E variations with other fundamental data before making purchase and sell decisions.

Source:

Will the Real P/E Stand Up?
American Association of Individual Investors
AAII Journal
2008
http://www.aaii.com/includes/DisplayArticle.cfm?Article_Id=3364&digit=593


Tuesday, September 09, 2008

Its Official: Fannie And Freddie Get The Boot From S&P 500 Index

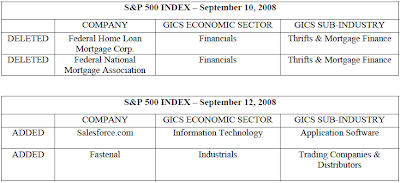
Today Standard & Poor's announced Federal National Mortgage Association (FNM) and Federal Home Loan Mortgage Corporation (FRE) will be removed from the S&P 500 Index at the close of trading on September 10th. The two companies that replace FNM and FRE after the close on September 12th are Salesforce.com Inc. (CRM) and Fastenal (FAST).

(click on table for larger image)


Monday, September 08, 2008

Unemployment Lags Stock Market Returns

A picture is worth a thousand words and the below chart fits that mantra. As Argus Research notes in the chart, courtesy of Charles Schwab & Co. (SCHW), the unemployment rate is often referred to as a lagging economic indicator. As such, it tends to peak after the market has already begun to recover.

(click on chart for larger image)

unemployment rate and S&P 500 Index chart as of September 2008The Fannie/Freddie bailout may be the event that puts a bottom into this market.

Source:

Unemployment & Stock Returns ($)
Market Watch-Argus Research
September 8, 2008
http://www.argusresearch.com/


Sunday, September 07, 2008

Presidential Election Cycle Myths And Realities

I have written a number of posts highlighting the market's return in the year prior to the election and the year of the election. A couple of recent posts noted the market tends to do well in the year of the election and more so as the uncertainty of the outcome is removed.
In the Saturday edition of The Wall Street Journal, Jason Zweig wrote an interesting article, If You Bet On The Election, Don't Use Real Money, focusing on some of the myths surrounding the market and the election cycle. One example used by Zweig for why the market tends to do well in the fourth year of the presidential cycle is the fact the Fed tends to lower interest rates in year three:
"...Rate cuts are most common in the third year of presidential administration -- helping explain why stocks have a significant tendency to do roughly twice as well in Year 3 of presidential terms as in years 1, 2 or 4.

Once you account for the market impact of the Fed's actions, the apparent predictive power of the presidential cycle evaporates; if you don't know whether the Fed will have to raise or lower interest rates, it doesn't matter which party is in power."
What about the belief that gridlock is a positive for the market?:
"Some pundits base that claim on numbers dating back to 1901. Dig into the data, however, and you discover that the gains from gridlock come entirely from a single year: 1919, when Woodrow Wilson, a Democrat, had to cope with a Republican House and Senate (and his own failing health). But it's absurd to give gridlock the credit for the Dow's 30.5% rise that year. Instead, it was the end of World War I, in the final weeks of 1918, that propelled the market to one of its best years ever."
The Journal article contains other interesting reviews of myths surrounding the market and elections that make the article a worthwhile read. What tends to be the most important takeaway though is the fact the market is more a function of where we are in the economic cycle than any antidotal impacts surrounding the election.

Source:

If You Bet On The Election, Don't Use Real Money
The Wall Street Journal
By: Jason Zweig
September 6, 2008
http://online.wsj.com/article/SB122065839024405687.html?mod=todays_us_nonsub_money_and_investing


Saturday, September 06, 2008

A Bell Won't Ring At A Market Bottom

In times of market stress, it is important to have a list of events to monitor that might signal a bear market is bottoming. An important element to following events that may signal a turning point in the market is the list will remove the emotional tendency to reduce equity exposure at the end of a market cycle.

In May, Liz Ann Sonders, Chief Investment Strategist at Charles Schwab & Co., wrote a strategy piece titled, New Paradigm Ahead? I have covered elements of this article in prior posts, but the important aspect outlined in this article was it contained a list of factors for investors to look for that might give clues to when the bear market ends. In Liz Ann Sonders update on the May article, The Bottoming Process, she notes a large number of the factors that could signal a market bottom seem to be falling in place.

Her original checklist contained factors that were already in place:
  • U.S. economy slows dramatically
  • U.S. Fed cuts interest rates dramatically
  • Dollar sinks further
  • Commodity prices go parabolic
  • Speculative hoarding of commodities ensues
  • Regulators and Congress rev up the anti-speculation rhetoric
  • Commodity-hungry emerging markets suffer
  • Global growth suffers, including noticeably in China
  • Investors shift funds from international stocks to commodities
Her recently updated article details events that have occurred since May:
  • U.S. Fed enters pause mode
  • Rate differentials support dollar rally
  • Commodity prices begin to correct
(click on chart for larger image)

commodities and dollar chart
There are four remaining events that need to unfold that could finally signal higher equity prices ahead:
  • Non-U.S. central banks consider rate cuts to fight growth slowdown
  • Commodities move from U.S. economic headwind to tailwind
  • Lower commodities/inflation supports U.S. valuation expansion
  • Investors shift from global stocks/commodities to U.S. stocks
As Schwab appropriately notes, one significant issue that is depressing the market is the fall out from the housing bubble. Some positive trends are unfolding there though as noted in the chart below:

(click on chart for larger image)

home price chart August 2008Finally,
"The late Sir John Templeton once remarked, “Bull markets are born on pessimism, grow on skepticism, mature on optimism and die on euphoria.” I [Liz Ann Sonders] like to think about the opposite for bear markets: They’re born on euphoria, grow on denial, mature on panic and die on despair. But they tend to end with a whimper, not a bang. In other words, they have generally hit a “momentum low” (the bang) followed by a period of additional weakness into the “price low” (the whimper), typically lasting about four months. As you can see in the table below, among the 21 major bottoms since 1900, only three have formed coincident with the low in price momentum: 1914, 1957 and 1970. Typically, stocks have slid 4%–5% after the momentum low."
(click on table for larger image)

market performance in bear markets and durationSource:

The Bottoming Process
Charles Schwab & Co.
By: Liz Ann Sonders
August 21, 2008
http://www.schwab.com/public/schwab/research_strategies/market_insight/todays_market/recent_commentary/the_bottoming_process.html?cmsid=P-2741120&lvl1=research_strategies&lvl2=market_insight&refid=P-2505603&refpid=P-2505585


Friday, September 05, 2008

August Was A Tough Month For Dividends

As I noted in an earlier post this week, the dividend payers under performed the non payers in the month of August. It wasn't just performance where the dividend strategy struggled though.

In the month of August, only 8 companies increased their dividends versus 17 in August of 2007.

(click on table for larger image)

dividend increase in August 2008 Standard & Poor's noted that:
"Outside of the S&P 500, the numbers are worse with 43 decreases (the most decreases since 1982 with 60 decreases), and 114 increases which is the least amount of increases since 2002 (108)."
For overall market performance a few positives were evident in the market:
  • "breadth turned positive, with 320 issues gaining (average +7.01%) and 177 declining (average -5.31%)."
  • a rotation out of energy and materials and into early cyclical sectors, like consumer discretionary, may have begun last month. Discretionary stocks made the largest contribution to the S&P's performance last month by returning 7.03%.
(click on table for larger image)

S&P 500 Index sector return contribution August 2008
Lastly, the market's action today may have served as a near retest of the lows reached in July. Constructively, higher downside volume, a capitulation type trading day, would certainly allow for making a stronger case for higher prices longer term.

(click on chart for larger image)

S&P 500 Index chart analysis September 5, 2008
Source:

Market Attributes Snapshot S&P 500 (PDF)
Standard & Poor's
By: Howard Silverblatt
August 2008
http://www2.standardandpoors.com/spf/pdf/index/MktAtt_Snapshot.pdf


Thursday, September 04, 2008

Undecided Investors Become More Bullish

This week's release of the American Association of Individual Investors Sentiment Survey saw an increase in individual investor bullish sentiment. The bullishness level increased to 37.04% versus last week's ready of 30.68%. Most of the increase came at the expense of a decline in the neutral investors. The neutral reading fell over four percentage points. The 8-period moving average of the bullishness level increased to 35.6% from 33.8%. Additionally, the bull//bear spread improved to minus 6% from minus 15%. In true fashion, as investor bullishness improved, the S&P 500 index fell from 1,281 to 1,275 at the time of the survey.

(click chart for larger image)


Tuesday, September 02, 2008

S&P 500 Dividend Payers Underperform Non Payers In August

In the month of August, the dividend paying stocks in the S&P 500 Index underperformed the non payers on an average return basis. The payers returned 2.49% versus 3.81% for the non payers. As noted in the table below, the payers underperformed the non payers year to date as well. The payers are maintaining a slight performance edge over the last twelve months. The higher quality Dividend Aristocrats are outperforming the S&P Index as outlined in my earlier post.