Saturday, February 28, 2009
S&P Cuts Dividend Rate On S&P 500 Index
Posted by
David Templeton, CFA
at
7:31 PM
0
comments
![]()
![]()
Labels: Dividend Analysis
Warren Buffett Releases 2008 Shareholder Letter
We’re certain, for example, that the economy will be in shambles throughout 2009 – and, for that matter, probably well beyond – but that conclusion does not tell us whether the stock market will rise or fall.
Posted by
David Templeton, CFA
at
12:13 PM
0
comments
![]()
![]()
Labels: Investments
Friday, February 27, 2009
Where Is The Market Bottom?
- Portfolio.com: Obama's total budget is $3.6 trillion, which works out at $34,000 per household; median household income is about $50,000. Which basically means that for every dollar that a US household earns, the US government plans to spend 68 cents next year.
- CNBC: [Obama] is declaring war on investors, entrepreneurs, small businesses, large corporations, and private-equity and venture-capital funds.
That is the meaning of his anti-growth tax-hike proposals, which make absolutely no sense at all — either for this recession or from the standpoint of expanding our economy’s long-run potential to grow.
Raising the marginal tax rate on successful earners, capital, dividends, and all the private funds is a function of Obama’s left-wing social vision, and a repudiation of his economic-recovery statements. Ditto for his sweeping government-planning-and-spending program, which will wind up raising federal outlays as a share of GDP to at least 30 percent, if not more, over the next 10 years.
The Bespoke Investment Group had a couple of graphics a few days ago detailing today's market action versus the market's correction from 1929 to 1954.
 Source: Bespoke Investment Group
The fact that the economy shrank at a rate of 6.2% last quarter -- the worst showing in more than a quarter century -- sounds pretty awful. But here's another way to look at it. The last time GDP dropped so precipitously (back in the first quarter of 1982) the Dow went on to gain 25% in the next 12 months.Let's hope history repeats itself as it applies to GDP centered data.
Posted by
David Templeton, CFA
at
7:43 PM
0
comments
![]()
![]()
Labels: General Market
Tuesday, February 24, 2009
Dividends Critical Component Of Total Return

The fastest reduction in U.S. dividends since 1955 is depriving investors of the only thing that gave stocks an advantage over government bonds in the last century.U.S. equities returned 6 percent a year on average since 1900, inflation-adjusted data compiled by the London Business School and Credit Suisse Group AG show. Take away dividends and the annual gain drops to 1.7 percent, compared with 2.1 percent for long-term Treasury bonds, according to the data.
..."It’s a greater fool theory if we always buy stocks based on earnings and we never get a penny out of it, hoping for someone to buy that stock at a higher price," said James Swanson, chief investment strategist at MFS Investment Management in Boston, which oversees $134 billion. "Dividends have been a cushion in bad times. If they go to zero it’s a disaster."
Source:
Dividends Falling Means S&P 500 Is Still Expensive
Bloomberg
By: Michael Tsang
February 23, 2009
http://www.bloomberg.com/apps/news?pid=20601213&sid=a0lVup_0DDwI&refer=home
(HT-The Float)
Posted by
David Templeton, CFA
at
11:14 PM
1
comments
![]()
![]()
Labels: Dividend Analysis
Too Many Just Consuming
 Recently, it seems some in this country would rather receive a fish versus learn to fish. The saying, "give a man a fish and he’ll eat for a day, teach a man to fish and he will eat for the rest of his life," reminded me of a recent email I received:
A self-important college freshman walking along the beach took it upon himself to explain to a senior citizen resting on the steps why it was impossible for the older generation to understand his generation.
"You grew up in a different world, actually an almost primitive one" the student said loud enough for others to hear. "The young people of today grew up with television, jet planes, space travel and man walking on the moon. We have nuclear energy, ships and cell phones, computers with light speed...and many more."
After a brief silence the senior citizen responded as follows. "You're right son. We didn't have those things when we were young...so we invented them. Now, you arrogant young man what are you doing for the next generation? The applause was amazing!
The U.S. needs to get away from giving everyone a fish.
Posted by
David Templeton, CFA
at
9:27 PM
0
comments
![]()
![]()
Labels: Economy , General Market
Monday, February 23, 2009
Chicago Fed National Activity Index Below Trend
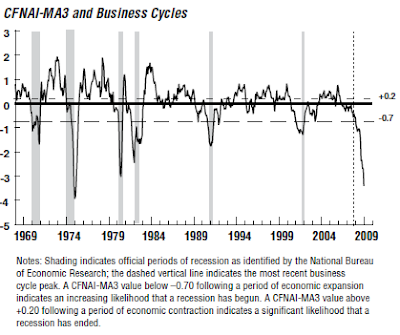
What is the CFNAI?
The index is a weighted average of 85 indicators of national economic activity. The indicators are drawn from four broad categories of data:A zero value for the index indicates that the national economy is expanding at its historical trend rate of growth; negative values indicate below-average growth; and positive values indicate above-average growth.
- production and income,
- employment, unemployment, and hours,
- personal consumption and housing, and
- sales, orders, and inventories.
When the CFNAI-MA3 value moves below –0.70 following a period of economic expansion, there is an increasing likelihood that a recession has begun. When the CFNAI-MA3 value moves above +0.70 more than two years into an economic expansion, there is an increasing likelihood that a period of sustained increasing inflation has begun.
Posted by
David Templeton, CFA
at
10:34 PM
0
comments
![]()
![]()
Labels: Economy
Sunday, February 22, 2009
A Correction For The Record Books
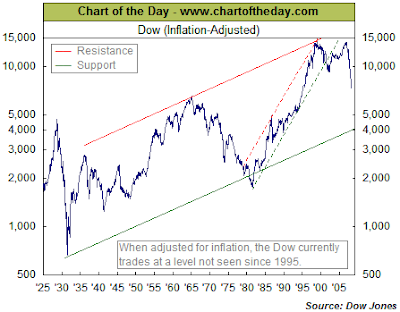
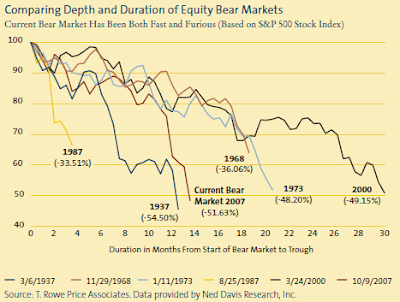
The Dow Jones Industrial Average (^DJI) correction that began on October 9, 2007 is now the second worst since 1900 and only behind the correction that began in 1929. According to Chart of the Day:
The Dow put in its record high of 14,164.53 back on October 9, 2007. [On February 19, 2009],the Dow closed at 7,465.95 – down 47.3% from its peak made 499 calendar days ago. For some perspective on the magnitude of the current bear market, today's chart compares the current, 499 calendar day old Dow correction to that of all other Dow corrections, 499 calendar days after their respective peak (and that were still ongoing).
Posted by
David Templeton, CFA
at
10:22 AM
1
comments
![]()
![]()
Labels: General Market
Saturday, February 21, 2009
Stocks Benjamin Graham May Have Found Of Interest
Graham believed that the defensive investor should select between 10 and 30 stocks that each have the following characteristics: large, prominent, and conservatively financed, with long records of continuous dividend payments. Such stocks should be purchased at attractive prices. As a yardstick, Graham suggested that the investor pay no more than 25 times average earnings over the past seven years, and no more than 20 times earnings over the last 12 months.
● S&P Quality Ranking > B+
● 3-Year Average ROE > 18%
● Total Debt to Invested Capital < 20%
● Enterprise Value to 3-Year Average EBIT < 7
● Free Cash Flow to Invested Capital > 40%
 Source:
Exploring Quantitative Strategies ($)
The Outlook
Standard & Poor's
By: Richard Tortoriello, S&P Equity Analyst
February 25, 2009
http://www.outlook.standardandpoors.com/NASApp/NetAdvantage/servlet/login?url=/NASApp/NetAdvantage/index.do
(It should be assumed I have a long interest in Chevron, Exxon Mobil, Genuine Parts and Nike)
Posted by
David Templeton, CFA
at
3:53 PM
0
comments
![]()
![]()
Labels: Investments
Friday, February 20, 2009
Investor Bullish Sentiment Continues To Fall
The $8.85 trillion held in cash, bank deposits and money- market funds is equal to 74 percent of the market value of U.S. companies, the highest ratio since 1990, according to Federal Reserve data compiled by Leuthold Group and Bloomberg....
Leuthold Group, whose Grizzly Short Fund returned 83 percent in 2008 thanks to bets against equities, said in its December bulletin to investors that stocks offer "one of the great buying opportunities of your lifetime."
Cash at 18-Year High Makes Stocks a Buy at Leuthold
Bloomberg
By: Eric Martin and Michael Tsang
December 29, 2009
http://www.bloomberg.com/apps/news?pid=20601213&refer=&sid=ablBbCLneo6o
Posted by
David Templeton, CFA
at
12:01 AM
2
comments
![]()
![]()
Labels: Sentiment
Tuesday, February 17, 2009
Standard & Poor's Advises Caution In Chasing Dividend Yield
A video discussion of dividends is available at this dividend video link. Not surprisingly, given the number of dividend reductions, Mr. Silverblatt advises caution in simply focusing on yield when selecting dividend paying stocks.
Source:
Good Dividend, Bad Dividend
BusinessWeek
By: Howard Silverblatt
February 11, 2009
http://www.businessweek.com/investing/insights/blog/archives/2009/02/good_dividend_b.html
Posted by
David Templeton, CFA
at
10:13 PM
0
comments
![]()
![]()
Labels: Dividend Analysis
Sunday, February 15, 2009
U.S. Dollar Continued Headwind For Multinational Companies
One factor is certain, hindsight shows the stronger US Dollar has had a negative impact on earnings for multinational companies in the 4th quarter of 2008. The currency exchange rate impact on earnings will likely have continued negative headwinds through 2nd quarter 2009 earnings results vis-à-vis the comparable periods in 2008.
Standard & Poor's February 18, 2009 The Outlook newsletter ($) reports some currency changes since March 31, 2008 to January 31, 2009 exchange levels:
- U.S. dollar +23% vs. the euro;
- +39% vs. the pound;
- +20% vs. the Canadian dollar;
- +55% vs. the zloty; and
- +33% vs. the real;
- +33%vs. the Mexican peso;
- +23% vs. the ruble
It seems the U.S. has been ahead of other countries in addressing the economic slowdown by being ahead of the curve in lowering interest rates as well as the government providing stimulus to the economy. Below is a table of some of the interest rate levels around the globe.

Posted by
David Templeton, CFA
at
4:50 PM
0
comments
![]()
![]()
Labels: Economy , General Market
Saturday, February 14, 2009
Sales Declining Faster Than Inventory

Posted by
David Templeton, CFA
at
2:18 PM
0
comments
![]()
![]()
Labels: Economy
Thursday, February 12, 2009
S&P 500 Index Still Holding Support

Posted by
David Templeton, CFA
at
9:54 PM
0
comments
![]()
![]()
Labels: General Market , Technicals
Wednesday, February 11, 2009
Near The Bottom If History Repeats Itself?

Posted by
David Templeton, CFA
at
8:11 AM
0
comments
![]()
![]()
Labels: General Market , Technicals
Tuesday, February 10, 2009
Investors Head For The Exit
Bloomberg picked up on this and provided commentary on the two new departments created for health care, Federal Coordinating Council for Comparative Effectiveness Research and National Coordinator of Health Information Technology, established out of this bill. The article, Ruin Your Health With the Obama Stimulus Plan, describes the infrastructure that is established out of the bill that will provide for national health care down the road. As the article notes, rationing health care to seniors will result as the new policies are implemented.
It seems the two positives from today's market action are both technical. The S&P 500 Index chart has maintained its positive flag formation as the market closed above the lower resistance line. The question is whether or not the market can maintain this support level around 820. Additionally, the MACD remains bullish although the fast moving average line has hooked downward.
Posted by
David Templeton, CFA
at
8:28 PM
0
comments
![]()
![]()
Labels: General Market , Technicals
Monday, February 09, 2009
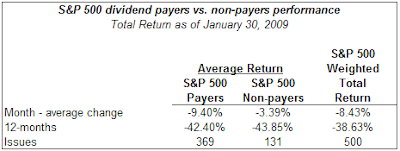
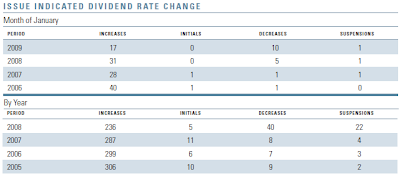
January Was Not Kind To Dividend Payers In The S&P 500 Index
 Source:
Market Attributes Snapshot (pdf)
Standard & Poor's
January 30, 2009
http://www2.standardandpoors.com/spf/pdf/index/2009_2_SP500.pdf
Posted by
David Templeton, CFA
at
9:59 PM
0
comments
![]()
![]()
Labels: Dividend Return
Sunday, February 08, 2009
Stimulus Bill Is Nearly Half Pork!
The Political Calculations website has a breakdown of the spending bill in a brief article titled:
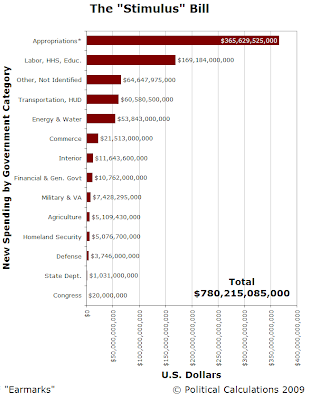 The seemingly "panic" efforts by the White House to pass this bill is representative of their lack of understanding of the the factors that are causing this economic crisis. Todd Sullivan has a brief comment that addresses the mark to market accounting issue in an article titled:
Posted by
David Templeton, CFA
at
10:12 PM
1
comments
![]()
![]()
Labels: Economy
Friday, February 06, 2009
Dividends In 2009: Trust But Verify
Howard Silverblatt, Senior Index Analyst at Standard & Poor's notes, "actual January dividend payments for the S&P 500 were down 23.9%, which speaks to the Q4 decreases, the $13.5 billion cuts year-to-date speaks to future payments."
S&P data shows:
Appropriately, Howard Silverblatt indicates, "the bottom line is that investors need to do a lot more homework than in years past as the prospect for future dividends remains extremely cautious. On former President Ronald Reagan’s 98th birthday, his words still ring true today, Trust but Verify."
- sixty-two S&P 500 companies decreased their dividends in 2008 by an aggregate $40.6 billion with forty-eight of the decreases coming from Financials ($37 billion).
- Over the previous five years (2003-2007), there were only 12 dividend decreases in the Financials sector amounting to $5.1 billion.
- So far in 2009, fourteen issues (nine of which are Financials) have decreased their dividend rate by over $13.5 billion.
Source:
S&P 500 Dividends Projected to Decline 13.3% in 2009;
Worst Annual Decline Since World War II (pdf)
Standard & Poor's
By: Howard Silverblatt and David Guarino
February 6, 2009
http://www2.standardandpoors.com/spf/pdf/index/020609_DividendRateChange.pdf
Posted by
David Templeton, CFA
at
8:54 PM
1
comments
![]()
![]()
Labels: Dividend Analysis
Thursday, February 05, 2009
Investor Sentiment Continues To Decline And Market Grinds Higher
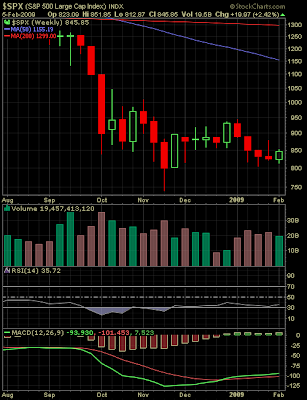
Since the November low, the S&P continues to trade within a slightly bullish trend channel. Recent trading though has set up a flag pattern as noted in the below chart. If the S&P can close above 855 and penetrate the top of the flag, the market could see a move towards the top of the longer term trend channel.

This is certainly a difficult market, but with all the seemingly bad headline economic news, the market seems to want to grind higher. Keep in mind, this is the technical aspect of the market and fundamentals will win out in the long run.
Posted by
David Templeton, CFA
at
9:04 PM
1
comments
![]()
![]()
Labels: Sentiment
Wednesday, February 04, 2009
Financial Innovation Has Benefited Innovators And Not Investors
Following are a couple excerpts from the article, Markets in Crisis (pdf):
...And another difference is visible in the trend toward ownership of securities and, particularly, stocks by institutional investors rather than individuals. Fifty years ago, individuals owned 92 percent of all stocks and financial institutions owned 8 percent. Today, individuals own only 24 percent of all stocks and institutions own 76 percent. I think a central problem is that these institutions have not behaved in an appropriate manner....
...Investment principles used to be focused on the wisdom of longterm investing rather than the folly of short-term speculation. Yet, we are witnessing an orgy of speculation in the market, the likes of which we have literally never seen in the United States. For example, in 1928, during the old speculative high, stocks had about a 140 percent annual turnover rate. In the 1950s and 1960s, when I first came into this business, turnover in the stock exchange had dropped from that speculative level to about 30 percent a year. In 2006, it rose to 200 percent. In 2007, it was 280 percent. And this year, turnover of stock is running at 320 percent. In sum, when I came into this business, there might have been two, three, or maybe four days in the course of a year in which the stock market would go up or down by 2 percentage points or more. Since the end of July 2007, there have been not two, three, or four such days; there have been 52 2-percent moves—21 upward and 31 downward....
Source:
Markets in Crisis (pdf)
Financial Analyst Journal
By: John C. Bogle and Rodney N. Sullivan, CFA
January/February 2009
http://www.cfapubs.org/doi/pdf/10.2469/faj.v65.n1.3
Posted by
David Templeton, CFA
at
12:01 AM
1
comments
![]()
![]()
Labels: General Market

