Saturday, October 31, 2009

Stryker Increases Dividend 50%

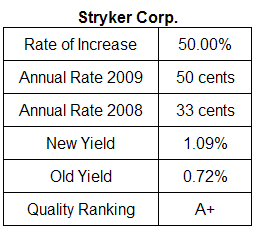
Yesterday Stryker Corp. (SYK) announced the company's dividend payment would be transitioned to a quarterly dividend from an annual one. In order to accommodate this change, SYK will pay a 10 cent fourth quarter dividend for 2009.
  • This will bring total 2009 dividends to 50 cents per share versus 33 cents per share paid in 2008. This represents a 51% increase in the dividend on a year over year basis.
  • Further, the company will begin paying a 15 cent per share quarterly dividend beginning in the first quarter of 2010. If the 2009 dividend is spread over four quarters (12.5 cents per quarter), the 2010 quarterly dividend will represent a 20% increase over the 2009 estimated quarterly dividend.
  • The payout ratio based on estimated 2009 earnings per share of $2.94 will be about 17%.
  • The company has an S&P Earnings & Dividend Quality Ranking of A+.


Thursday, October 29, 2009

Bullish Sentiment At Lowest Level Since July 16th

This week's release of bullish investor sentiment by the American Association of Individual Investors shows bullish sentiment fell to 33.65%. This is the lowest level for the bullishness reading since the bullishness reading was reported at 28.68% for the week of July 16, 2009. The eight period moving average fell slightly to 39.83% versus the prior week's average of 40.37%.


Individual investors do not appear to have reached the overly bullish state as of yet.


Monday, October 26, 2009

Supervalu Cuts Dividend

Catching up after some travel.

Last week Dividend Aristocrat Supervalu (SVU) cut the company's dividend by 50%. SVU becomes the first consumer staples stock to reduce its dividend.
  • The new quarterly dividend is reduced to 8.75% from 17.5%.
  • The company's second quarter earnings came in at 35 cents per share versus 61 cents per share in the same quarter last year.
  • Full year earnings for February 2010 are estimated to come in at $1.94 and February 2011 earnings are projected at $2.01.
(click to enlarge)

Suppervalu dividend analysis table
Supervalu stock chart


Sunday, October 25, 2009

Fund Flows During And After The Crisis

Investors who stuck with equity investments (S&P 500 Index) in October 2008 and through the March 2009 sell off would now be up 9% from October 2008 through August 2009. Many investors liquidated equity investments in October and again in March.
  • Investors withdrew $70 billion from the stock market in October 2008 and another $50 billion in the February/March 2009 period.
  • As of October 16, 2009, one year after the peak in liquidations, investors who remained in the stock market had fared better than those who exited at the peak of the crisis and stayed on the sidelines.

One implication for investors as it relates to this data is the difficulty in trying to time the market. For investors, focusing on high quality dividend growth stocks provides the potential to minimize the downside volatility in the equity portion of ones portfolio.

Source:

Stay-the-Course Ahead of Panic Sellers
By: Fidelity's Market Analysis, Research, & Education Group
October 23, 2009
http://publications.fidelity.com/investorsWeekly/investorsWeekly/cms/IW0910crisis.dyn


Friday, October 23, 2009

Economic Activity Picking Up?

As readers may have noticed from the limited number of posts to my blog this week, I was away from the computer due to some out of town travel. I traveled by car from Ohio to Florida on I-75. Along with my travel companion, we both commented on the number of semi trucks that were traveling the highway. The parking lots at a couple of truck stops we passed were packed full with semis. Even several of the rest areas were packed with semis. I am guessing all these trucks were not traveling with empty loads. At a minimum, I think the economy is experiencing some inventory restocking activity and possibly a pick up in consumer demand.


Tax and Spend

As I have noted in several earlier posts, Congress is looking to place a tax on stock trades. They have not given up on this trading tax as noted by the below screen shot from my Site Meter account.

(click to enlarge)

taxing stock trades


Saturday, October 17, 2009

Correlations Have Increased

Investors are often advised to spread their investments across differing asset classes because of the lower correlation of these other asset classes. Unfortunately, the correlation of many of these other asset classes has continued to increase.

I have discussed this issue of higher correlation in earlier posts:
Fidelity's Market Analysis, Research and Education (MARE) group recently updated correlation data as of August 31, 2009. As the below table notes, correlation versus the S&P 500 Index has increased across a number of asset classes except U.S. Government Bonds.


MARE notes the potential investment implications:
  • U.S. government bonds performed very well as riskier assets tumbled during the financial crisis in 2008, but so far in 2009 have fared poorly as riskier assets have rallied amid signs of economic stabilization and improvement.
  • There are potential scenarios where U.S. bonds could either hold up well in the months ahead (a double-dip recession, further financial system turmoil, etc.) or underperform riskier assets (rising inflation, increased concerns about the U.S. fiscal deficit/creditworthiness, or a better-than-expected economic recovery).
  • It remains to be seen whether the recent increase in correlations among riskier assets will define a new, more highly correlated era. In any case, investors are likely to be on safer ground anticipating that U.S. government bonds will continue to be one of the few ways to effectively diversify a portfolio.
In the end, investors need to be aware of this move towards higher correlation across a number of asset classes. Simply spreading ones investments into various asset classes will not necessarily ensure a higher risk adjusted return.

Source:

Where To Find Diversification In A Highly Correlated World (PDF)
Fidelity (MARE)
September 21, 2009
http://personal.fidelity.com/products/funds/content/pdf/where-to-find-diversification.pdf

Thursday, October 15, 2009

Investors Sentiment Turns Bullish

This week's sentiment survey by the American Association of Individual Investors saw bullish investor sentiment jump by 12.21 percentage points. The bull/bear spread was reported at +14 versus -6 last week. These weekly measures are volatile and looking at the 8-week moving average smooths out this variability. The 8 week average increased to 39.56% compared to 37.90% last week.


The bullishness reading is a contrarian indicator and a continued increase in individual investor bullishness would be one signal the market could be approaching at least a short term top.


Stock Market's Upside Potential

When determining the future direction of the market, many investors and strategist turn to the price to earnings ratio. One key to using the P/E ratio is the calculation of earnings. Earnings are reported in several forms, one being "reported earnings" and the other referred to as "normalized" earnings. One significant point made in the article is the justification of using normalized earnings. Easterling notes,
"...if you only look at the P/E ratio reported for any quarter or year, the ratio during peaks and troughs will be quite distorted when compared to the more stable long-term average. About every five years or so, the reported P/E will reflect the opposite signal in contrast to a more rational view of P/E valuations. For example, the reported value for P/E in early 2003 reflected a fairly high value of 32 just as the S&P 500 Index had plunged to 800 (E had cycled to a trough of $25 per share). A P/E of 32 generally screams “sell” to most investment professionals; yet, in early 2003, that was a false signal! A more rational view using one of the business cycle-adjusted methods reflected a more modest 18. In a relatively low inflation and low interest rate environment, the scream should have been “Buy”…

Several years later, in 2006 (after an unusually-strong run in earnings growth), E peaked at $82 per share as the S&P 500 Index was hesitating at 1500. Most market pundits were recommending a strong “buy” due to a calculated P/E of only 17. Yet, using the rational business cycle-adjusted methodologies, the true message was “STOP”—P/Es were saying sell, with P/E more than 25.

Well the pundits were actually (sort of) right—P/Es did expand… Yet it was due to (what should have been expected) the normal down-cycle in E rather than the pundit-promoted increase in the stock market. So when investors’ stock market accounts were down almost 50%, they were handed explanations that the earnings decline was unexpected and the fault of the financial sector…

Many of the same pundits are bewildered by current market conditions and unsure about the future of E. The latest craze to extrapolate current conditions into the indefinite future has been named “The New Normal.” Slow economic growth, high saving rates, and unstable financial conditions—all fairly typical at the end of a recession—are now basic assumptions for years into the recovery expansion. Maybe this time will actually be different…or maybe not…

As for the market and P/E, it’s understandable that conservative investors and market spectators have watched the past six-month rally with awe. Yet the current P/E remains slightly undervalued and further gains are more likely; nonetheless, it is important to remain aware that typical market volatility makes it also likely that the market will experience significant short-term swings."
Ed Easterling of Crestmont Research provides an update on the market valuation in his quarterly P/E Report. The most recent report is detailed below and is a worthwhile reading. Beginning on page 4 of the report, he goes through his analysis of the potential target on the market (see Figure 6 on page 12.) Not that the market will go up in a straight line, but he does build a case for a 3-year target price on the S&P 500 Index of 1,685. The earnings figure utilized in the target is a normalized one that has been adjusted for inflation. A similar inflation adjusted valuation measure is used by Robert Shiller of Yale University.

The PE Report

The article's conclusion is the market remains in a secular bear market while still undervalued. As Crestmont has noted before, cyclical bull markets are common in longer term or secular bear market periods. Crestmont updates a table noting prior bear and bull market cylces.

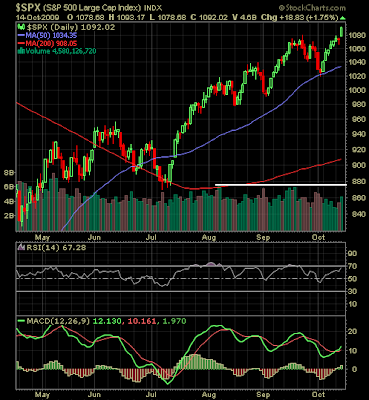
For investors, inflation is a critical variable that will impact the value of the market. Staying abreast of inflation data points will provide some insight into the markets future direction. The advance from the market's March low has been impressive. Today's move above 10,000 on the Dow and 1,090 on the S&P 500 index was important from a technical point of view. Interestingly, the volume today was better than what we have seen of late, which is good, but the volume level is not what one would see at capitulation buying points. This is only "one" technical factor, but it would suggest the market could still move higher as some investors are in disbelief that the market has not had a significant correction that would consolidate the gains since March.

(click to enlarge)

S&P 500 chart October 14, 2009


Sunday, October 11, 2009

Investor Sentiment Indicates Investors Are Cautious

Over the past month, investor bullish sentiment has continued to trend lower as measured by the 8-period moving average of the bullish sentiment reading. Last week's bullishness reading of 35.09% feel below the long term average of 38.94% as reported by the American Association of Individual Investors. Additionally, last week's reading was nearly 8.5 percentage points lower than the bullishness reading in the prior week. The bull/bear spread was -6% versus +8% last week.


Friday, October 09, 2009

Market Performance After Big Down Years

This has been a year that the old adages like "Sell in May and Go Away" or September is the worst month for market performance did not hold true. Some attribute this to the fact the market simply overshot on the downside in March.

In line with these adages, the market's performance in the year following big down years has generally been strong. Courtesy of Chart of the Day, the following chart notes the market's performance tends to be strong in those years following the years where the market declined significantly. As the chart notes, the exceptions were the early 1930's and 1978.

The below chart presents the performance of the Dow for the calendar year following the 15 worst calendar year performances of the Dow since 1896. The Dow's performance during the 2008 calendar year was the third worst on record. Could there be more upside to the market as we move into the end of this year?

(click to enlarge)


Thursday, October 08, 2009

RPM International Increases Dividend 2.5%

For the 36th consecutive year, RPM International (RPM) announces a YOY increase in its quarterly dividend to 20.5 cents per share. This compares to a quarterly dividend of 20 cents per share in the same period last year: a 2.5% increase.

The estimated payout ratio is 65% based on May 2010 estimated earnings of $1.26. May 2011 earnings are estimated at $1.50. RPM earnings have been impacted by the economic slowdown resulting in payouts of 80%, 176% and 38% over the course of the last three years. RPM carries an Earnings and Dividend Quality Ranking of B.

(click to enlarge)

RPM International dividend analysis table October 2010
RPM Stock chart October 2010


Monday, October 05, 2009

Hayman Advisors 3Q Newsletter

J. Kyle Bass and his firm made billions shorting subprime mortgages prior to the mortgage meltdown. The below third quarter newsletter provides perspective on current monetary policy around the world. The newsletter contains an in depth discussion on China, Japan and the timing of potential inflation. The commentary is a must read for investors.


Hayman Advisors Third Quarter 2009 -


(H/T: Zero Hedge, Pragmatic Capitalist)


Thursday, October 01, 2009

Tobin's q and The S&P 500 Scatter Chart

I had a reader (H/T br) send me a scatter chart of Tobin's q and the S&P 500 Index. The data period is 1950-1999. I added a line estimating where the second quarter ratio would fall at .78.
tobins q & S&P 500

Another chart sent by the reader contains a scatter chart of the S&P 500 Index's future 10-year annualized return versus the inflation adjusted 10-year average P/E ratio. This data was obtained from Robert Shiller's data base (.xls file).
S&P 500 Return and PE Scatter Chart


Dividend Payer's Return Lags Non Payers

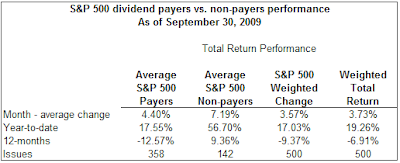
As of the end of September, the return for the dividend payers in the S&P 500 Index continues to badly trail the return of the non payers. On a year to date basis, the payers' return equals 17.55% versus the non payers' return of 56.70%. The strongest performing stocks have been the lower quality ones and these tend to not pay dividends.

(click to enlarge)

dividend payers versus non payers September 30, 2009Howard Silverblatt noted in a Dow Jones News Wire release:
In the third quarter, of about 7,000 U.S-traded companies, 191 increased their dividend for the period, down from 346 a year earlier and 439 in 2007. In contrast, 113 companies lowered their dividend payment during the quarter, down from 138 in 2008 but up from just 21 in 2007.

Howard Silverblatt said the third-quarter figures suggested that dividends may have finally hit a bottom. But he warned it may take several quarters of proven results for companies to be comfortable with increasing, or initiating dividends. Even then, Silverblatt said the level will likely be more subdued than what was seen two years ago.

According to Silverblatt, dividend increases have outnumbered cuts every year since 1955, with the average being 15 increases for every decrease. So far this year, the relationship is almost even, with increases at 707 and decreases at 730.