Tuesday, April 27, 2010

A Return To Quality

There is no doubting the strong market return that has occurred over the past 12-months. One characteristic of this advance is the fact lower quality stocks as measured by S&P's Earnings & Dividend Quality Ranking have mostly outperformed the higher quality ones.


If one looks at stocks like Abbott Laboratories (ABT) that has an S&P Quality Ranking of A and MGM Mirage (MGM) that has an S&P Quality Ranking of B-, MGM has outperformed ABT and the S&P 500 Index by a pretty wide margin.

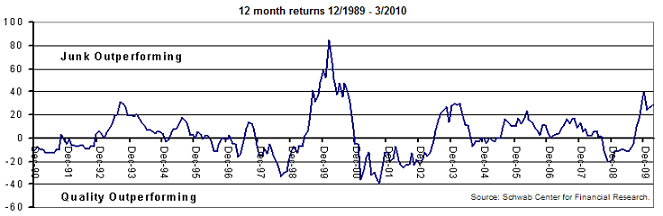
In a recent study by Schwab's Center for Financial Research, they show that higher quality tends stocks tend to outperform lower quality stocks in the periods following large outperformance by lower quality stocks.
"When quality underperforms junk by 20% or more, the subsequent 12-month relative return tends to favor quality, on average, by 4.5%. On average, quality has outperformed junk by 11.5% in the year following large junk rallies (over 40%)."
Generally, the highest rating a non dividend paying stock will receive from S&P is A-; therefore, the A+ and A rated stocks tend to consist mostly of dividend paying companies.

If history does repeat itself, returns for higher quality stocks over the course of the next 12-months are likely to outpace the lower quality ones. Currently, lower quality stocks are outperforming higher quality ones by over 28 percentage points. Additionally, given the global economic issues that bubbled to the surface today, i.e., sovereign debt issues with Greece and possibly Portugal, higher quality stocks are likely to be a safer bet than lower quality ones.

Source:

Where Is Quality Hiding
Charles Schwab & Co.
By: John Wightkin, CFA
April 27, 2010
http://www.schwab.com/public/schwab/research_strategies/market_insight/investing_strategies/stocks/where_is_quality_hiding.html?cmsid=P-3549031&lvl1=research_strategies&lvl2=market_insight

Disclosure: long ABT


Saturday, April 24, 2010

More Companies That Increased Dividends Last Week

Catching up on some dividend announcements from this past week: Johnson & Johnson (JNJ), Southern Company (SO), Kellogg (K).


Johnson & Johnson
  • announced a 10.2% increase in the quarterly dividend to 54 cents per share versus 49 cents per share in the same quarter last year.
  • based on 2010 estimated earnings per share of $4.85, the projected payout ratio is 45%. This compares to the 5-year average payout ratio of 41%.
  • JNJ carries an S&P Earnings & Dividend Quality Ranking of A+.

Southern Company
  • announced a 4% increase in the quarterly dividend to 45.5 cents per share versus 43.75 cents per share in the same quarter last year.
  • based on 2010 estimated earnings per share of $2.35, the projected payout ratio is 77%. This compares to the 5-year average payout ratio of 74%.
  • SO carries an S&P Earnings & Dividend Quality Ranking of A-.

Kellogg
  • announced a 8% increase in the quarterly dividend to 40.5 cents per share versus 37.5 cents per share in the same quarter last year.
  • based on 2010 estimated earnings per share of $3.59, the projected payout ratio is 45%. This compares to the 5-year average payout ratio of 47%.
  • K carries an S&P Earnings & Dividend Quality Ranking of A+.


Disclosure: Long interest in JNJ, K


Thursday, April 22, 2010

Investor Sentiment Volatility

This week's investor sentiment survey reported by the American Association of Individual Investors saw a decline in bullish investor sentiment of over 10 percentage points. The bullish sentiment reading was reported at 38.12% versus the prior week's reading of 48.48%. Eleven out of the first sixteen weeks of this year saw changes in the sentiment reading of + or - five or more percentage points. This is a similar number of weeks as were reported in the first four months of 2009. The 8-period moving average of the bullishness reading increased to 40% versus last week's level of 39.6%. This is the fourth consecutive week that the 8-period moving average has increased. The bull/bear spread narrowed to 4% versus 19% last week.


Tuesday, April 20, 2010

Procter & Gamble Increases Dividend 9.5%

For the 54th consecutive year, Procter & Gamble (PG) announced it is increasing the company's quarterly dividend. The new quarterly dividend increases 9.5% to 48.18 cents per share versus 44 cents per share in the same period last year. The estimated payout ratio will equal 48% based on June 2011 estimated earnings of $4.05. The 5-year average payout totals approximately 42%. P&G carries an A+ S&P Earnings and Dividend Quality Ranking.


Disclosure: long interest in PG


Sunday, April 18, 2010

Magnitude Of Rally Not In Uncharted Territory

An interesting chart published by Chart of the Day compares the current post bear market rally to similar periods that occurred in the past.


As Chart of the Day states,
"a 'massive' bear market is defined as a decline of greater than 50%. Since the Dow's inception in 1896, there have been only three bear markets whereby the Dow declined more than 50% (early 1930s, late 1930s until early 1940s, and during the very recent financial crisis). Today's chart also adds the rally that followed the dot-com bust during which the Nasdaq declined 78%. One point of interest is that the current Dow rally has followed a path that is fairly similar to that of the Nasdaq rally that began in late 2002. It is also worth noting that each rally lasted from about 300 to 370 trading days and then moved into a trading range/choppy phase that lasted for a year or more. In the end, the current post-massive bear market rally is by no means atypical."
So are we entering a range bound or choppy phase in the market? Seasonal influences could impact upcoming trading as the summer months approach.


Stock Buybacks: Actions Speak Louder Than Words

Companies in the S&P 500 Index are once again announcing stock buybacks with an increase in buybacks in the fourth quarter last year. Standard & Poor's reports though, the buybacks are essentially offsetting dilution from employee's exercising stock options. S&P reports that most of the companies that had actual reductions in share count in the 4th quarter were found in the consumer discretionary sector.

In looking at the actual dollars expended on buybacks:
  • $47.8 billion in Q4, 2009, $34.8 billion in Q3, 2009 and $24.2 billion in the record setting low period of Q2, 2009.
  • The high point for buybacks occurred in Q3, 2007 when $172 billion of stock were repurchased by companies.
Source: BusinessWeek

As the above chart notes buybacks are on the increase (red line). A true factor worth watching is a substantial increase in dividends paid. The fourth quarter saw a small increase in dividends paid out over Q3, 2009, $49.04 billion versus $47.21 billion, respectively. Dividend payments are a longer term commitment by companies and signal stronger business prospects than buyback announcements. As the below chart notes, cash is accumulating on corporate balance sheets. Commiting to a growing dividend payment would be a positive sign.


Bullish Investor Sentiment Continues Moving Higher

This past week's investor sentiment survey that was released by the American Association of Individual Investors indicates individual investors continue indicating they are more bullish. This past week's bullishness reading was the fourth straight week that the reading came in at a higher level than the prior week. Additionally, the 8-period moving average increased for the fourth straight week as well.

The individual investor bullishness reading was reported at 48.48% versus last week's reading of 42.86%. The 48%+ reading is the highest level reached this year. After Friday's market action and the Goldman Sachs (GS) news, next week's reading may see a dip.


Friday, April 16, 2010

Household Survey Versus Non Farm Payrolls

Which payroll survey is more accurate: the Nonfarm Payroll (Establishment) survey, which shows 162,000 new jobs have been created since December or the Household survey, which shows over 1 million new jobs have been created since December?


Argus Research notes:
"In the year ending August 2003, for example, the Payroll survey originally showed a loss of 463,000 jobs, whereas the Household Survey showed the economy had added 313,000 jobs. At that time, Carnegie Mellon economist Alan Meltzer wrote that the reason for the discrepancy is 'that the number of companies does not remain fixed. In our dynamic economy, old firms die and new ones are born. The Labor Department learns about the deaths quickly, but it takes longer to learn about the births.'"

"In periods of significant downsizing, such as the past two recessions, we think the Household survey is much more likely to be accurate. Using available surveys, we calculate that since 1948, the bottom in Household employment has, on average, occurred 2.9-months before the bottom in Payroll employment. We conclude that U.S. employment bottomed in December."


Saturday, April 10, 2010

Investors Continue Piling Into Bond Funds

One thing investors have a tendency to do is chase returns. Market technicians look at investor fund flow data as a contrarian signal. Given the poor long term return of many stock related investments and the strong bond returns one would think investors might be more attracted to equity investments at the moment. In fact bonds have outperformed stocks over the last 10 and 20 year period and given the low level of interest rates can this possibly continue? In a recent research piece by Fidelity titled, Stocks Anyone? (PDF), it is noted,
"investors actually took money out of stock funds on a net basis during the past year. Meanwhile, the $385 billion of net flows investors put instead into bond funds is more than they ever put into stock funds during a 12-month period—even during the technology bubble of the late 1990s."
Although investors are investing some of their funds into equities, a majority of the inflows are going into bond funds as outlined in the below table.


Additionally, the below charts indicate graphically that investors do have a tendency to chase returns; however, that has not been the case over the course of this past year. Although stocks are outperforming bonds significantly, net flows continue to favor bond funds.


Maybe the significant equity shocks of the last decade (technology bubble and real estate bubble) have resulted in investors taking a longer perspective on equity returns. The below chart compares the 10-year rolling relative performance to fund flows.


This lack of investor interest in stocks is a contrarian sign that suggest equity investors might have a performance advantage compared to bond investors on a forward looking basis.

Source:

Stocks Anyone? (PDF)
Market Analysis, Research & Education
Fidelity
By: Dirk Hofschire, CFA
March 25, 2010
http://personal.fidelity.com/products/pdf/stocks-anyone.pdf


Thursday, April 08, 2010

TJX Cos. Increases Dividend 25%

Earlier this week TJX Cos., Inc (TJX) announced a 25% increase in the company's second quarter dividend. The new quarterly dividend will be 15 cents per share versus 12 cents per share in the same period last year. The dividend payout ratio is projected to equal 19% based on estimated January 2011 earnings of $3.18. The projected payout compares to the 5-year average payout ratio of 16%. TJX carries an S&P Earnings & Dividend Quality Ranking of A+.


Bullish Investor Sentiment Essentially Unchanged

This week's sentiment survey reported by the American Association of Individual Investors saw a small uptick in bullish investor sentiment. The bullishness reading came in at 42.86% versus 41.30% last week. The 8-period moving average has moved higher for the third straight week., increasing to 38% versus 37.2% last week. The AAII survey represents the percentage of individual investors who are bullish, bearish, and neutral on the stock market for the next six months; individuals are polled from the ranks of the AAII membership on a weekly basis.


The Key Is Cash Flow

A recent article appeared in Forbes magazine that focused on the importance of cash flow versus earnings per share. The article, Investing Via Cash Flow, highlighted the success of Martin Saas, chairman of MD Saas. In the Forbes article, Saas notes, "investors get too fixated on the reported earnings...I am religious about cash flow. To me it's the most important number." Saas believes investors should start their review of the financial statement with the "cash flow from operations" statement.
This essentially consists of net income with noncash charges (like depreciation and deferred taxes) added back and cash-draining events (like an inventory pile-up) taken out. Now subtract maintenance-level capital expenditures. The company will tell you its total cap-ex; divining how that divides between maintenance and expansion is a tricky business, but you can strip out discretionary expenditures such as when oil companies increase drilling activity. What you're left with is free cash flow.
Source:

Investing Via Cash Flow
Forbes Magazine
By: Daniel Fisher
March 25, 2010
http://www.forbes.com/forbes/2010/0412/investing-cash-flow-sass-equities-ebitda-cash-does-not-lie.html


Sunday, April 04, 2010

The Impact Of Higher Taxes On Stock Prices

In an effort to look past the health care rhetoric, one aspect of the legislation that we know is coming is higher tax rates. In addition to the higher taxes that are a apart of the new legislation, the Bush tax cuts will expire after 2010 as well. So what does history say about higher taxes and stock prices.

It has been 23 years since capital gains tax rates were increased. The last increase occurred when Ronald Reagan was president. A big part of what Reagan did with taxes was lower the highest marginal tax rate on income from 50% to 28%. However, Reagan did increase the tax rate on capital gains from 20% to 28% beginning in January 1987. What occurred in 1986 was the unleashing of the corporate raider. A recent article in Financial Advisor magazine noted:
It was the age of the corporate raider and folks like T. Boone Pickens. Carl Icahn and Ronald Perelman were making the CEOs of America's biggest companies quake in their stretch limos. With a huge assist from Drexel Burnham Lambert's junk bond department in Beverly Hills, these characters were putting companies into play on a weekly basis. The rest of Wall Street was frantically scrambling to clone Drexel's incredible profit machine and struggling to create their junk bond units to finance LBOs....

When the 1986 tax act became law, these raiders sensed opportunity and took off on a bender that would last for more than two years. Shareholder value was their mantra. Almost every day, they would tee up companies and demand that their boards work over time to quickly complete the deal to give shareholders the full advantage of the soon-to-expire 20% capital gains tax rate. In actuality, most raiders were hoping that a bigger corporation, or so-called white knight, would swoop in and trump their offers.

Did the expiration of the 20% capital gains tax rate in January 1987 hurt stock prices? Hardly. From January to September, equities went crazy. Propelled perhaps by the big cut in income tax rates, the Dow climbed from 1,897 to over 2,700 on August 25 in a frenzy that looked like a runaway train going down Mt. Everest.
The fall out from this junk bond era is well know, but it is worth noting that stocks performed well during this time period. For bond holders, they should have some knowledge of history.
Fed chairman Paul Volcker discerned the all-too-obvious symptoms of an overheating economy and decided he'd had enough of all this nonsense. In April, he jacked up interest rates dramatically, triggering a $100 billion bath for bondholders around the globe.
One aspect that is different this time is income taxes will be on the rise. David Kelly, chief market strategist for J.P. Morgan Funds notes:
  • starting in 2013, the Medicare tax rate on households with income over $250,000 will be increased from 1.45% to 2.35%.
  • a new 3.8% Medicare tax will be introduced for this same group on investment income.
  • the tax rate on dividends and long-term capital gains will increase from 15% to 20% for households earning over $250,000 and with the new Medicare tax, these rates will rise to 23.8% for the same group.
  • Under current tax law, investors get to keep 85% of the income stream from taxable stock market investments. Under this new law this will be cut by 8.8% to 76.2%, reducing the value of the income stream by 10.4% (that is 8.8% of 85%).
  • using a number of broad assumptions, the value of the average stock should be reduced by one quarter of 10.4% or 2.6%—not good obviously, but also not an overwhelming reason to avoid stocks after a 12 month period in which they rose by over 70% and still appear undervalued.
Certainly, an investor's income stream will be impacted by the higher tax rates. The question becomes what are the alternatives to stocks and dividend paying stocks for that matter? If the Fed is preparing to raise interest rates (maybe not until later this year), what will be the impact on bonds? Additionally, with the precarious budget situation with a number of municipalities, tax free bonds may not be the safe haven expected by many investors. In short, don't let the tax tail wag the dog. Some perspective on history is contained in the article, Animal Spirits: The Last Time Capital Gains Taxes Rose.

Source:

Animal Spirits: The Last Time Capital Gains Taxes Rose
Financial Advisor Magazine
By: Evan Simonoff
March 25, 2010
http://www.fa-mag.com/blog/evan-simonoff/5357-animal-spirits-the-last-time-capital-gains-taxes-rose.html

Investment Implications of Health Care Reform
Financial Advisor Magazine
By: David Kelly, chief market strategist for J.P. Morgan Funds
March 22, 2010
http://www.fa-mag.com/online-extras/5344-investment-implications-of-health-care-reform.html


Dividends And Buybacks On The Increase

It is projected that dividends and stock buyback activity will increase in the second quarter of 2010 versus 2Q 2009. According to Howard Silverblatt, Senior Index Analyst at Standard & Poor's:

[expectations are that] second quarter 2010 dividend payments will be higher than second quarter 2009, but still 17% off 2Q 2008. A surge in increases is expected late in the third quarter if companies feel secure in their prospects to commit to future payments. 2010 payments are estimated to be up 5.6% to US$206B. This compares to payments of US$196B in 2009, US$248B in 2008, US$247B in 2007, and US$ 225B in 2006.

With respect to buybacks, Howard Silverblatt notes:
[buybacks are estimated to show] a 37% increase in fourth quarter 2009 over the third quarter 2009, which is 1% less than the fourth quarter of 2008 and 66% less than 4Q 2007. Looking at issues, MSFT (US$ 3.87B versus US$ 1.54B for Q3 2009), KO (US$ 1.51B versus minor) and PG (US$ 1.46B versus US$ 0.01B) returned, with HPQ increasing (US$ 2.7B versus US$ 2.1B), as CSCO (US$ 1.37B versus US$ 1.87B) and DTV (US$ 0.08B versus US$ 0.94B) reduced.

Overall, dollar purchases are ahead by over 39%, but are up 30% void of top issues. Lots of buyback announcements have occurred, but they come down to authorizations and a willingness to get back in the market – actual buys will depend on market conditions. Given that companies are still covering options to prevent dilution...

Source: Standard & Poor's


Friday, April 02, 2010

For Dividend Investors, It Is All About The Cash

As important as the stock yield percentage might be for investors, looking at dividend growth investments is more than simply looking at the yield on a particular stock. Certainly, history shows that a large part of the market's total return is attributable to the dividend return. Since 1926 the dividend component of the S&P 500 has accounted for one-third of the index's total return. An important aspect of focusing on dividends is it provides an investor insight into a company's cash flow.

One of the most important financial statements an investor can review when evaluating a company is the cash flow statement. A recent article reacquaints investors with the importance of this statement. One thing a company can't manipulate is cash. Cash is cash and cash is king as they often say.

As the article, Show Me the Money: Tracing a Firm's Cash Flow, shows, the cash flow statement provides investors with a wealth of information. Under the "financing section" of the statement, investors should pay particular attention to the activity surrounding the stock account. Many companies are once again announcing stock buybacks, but are the buybacks actually reducing the shares that are outstanding? Maybe the buybacks are simply offsetting potential dilution from option exercises.

The Show Me The Money article is timely for investors as many companies are once again focusing on dividends and buybacks as company fortunes seem to have stabilized.


Thursday, April 01, 2010

Dividend Payers Outperform Non Payers In First Quarter Of 2010

During the first quarter of 2010, the dividend payers in the S&P 500 Index outperformed the non dividend paying issues. The outperformance was small with the payers average return equaling 8.37% versus 8.35% for the non payers. In the month of March, no S&P 500 company reduced or suspended its dividend. This compares to March 2009 when 12 companies reduced their dividends.

What is interesting to note about the quarterly performance results is the dividend payers only outperforming month was January when the the payers were down 2.5% and the non payers were down 4.8%. Losing less money in down markets is one key to achieving longer term performance goals. Dividend payers are one way to take advantage of this performance advantage.


Uptick In Bullish Investor Sentiment

This week's individual investor sentiment as reported by the American Association of Individual Investors saw an uptick in bullish sentiment. The bullish sentiment reading increased 8.9 percentage points to 41.3%. This is slightly above the long term average of 39%. Additionally, the less volatile 8-period moving average of the bullish sentiment reading increased to 37.2% versus last week's average of 35.7%. This is the first increase in the 8-period average since January 14th.