
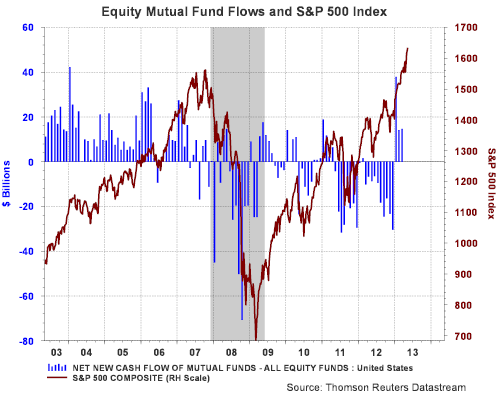
Not much seems able to restrain the strength of the bull market in U.S. equities. On a year to date basis the S&P 500 Index is up 15.43%. The advance has finally drawn investors into equity mutual funds as reflected in positive equity mutual fund flows the first three months of the year.
 |
| From The Blog of HORAN Capital Advisors |
The positive market results continue to keep the S&P 500 Index in a positive uptrend channel that began in the middle of November of last year. Aside from the fact company fundamentals and valuations look reasonable, at least not overvalued, higher equity prices could continue to unfold. However, we have noted in several recent posts the rotation that has occurred of late out of the more defensive sectors into the more cyclical ones.
 |
| From The Blog of HORAN Capital Advisors |
Because of the significant amount of artificial stimulus being pumped into the global economy by most central banks around the world, we believe investors need to have a heightened focus on the underlying technical aspects of the market in order to gain insight into potential market turning points. No one technical indicator is the panacea that will predict the market's future direction. One indicator useful to evaluate for the market and/or individual stocks is the Money Flow Index (MFI). This index is a variation of the Relative Strength Index (RSI). The StockCharts.com website provides the following definition of MFI:
"The Money Flow Index (MFI) is an oscillator that uses both price and volume to measure buying and selling pressure. Created by Gene Quong and Avrum Soudack, MFI is also known as volume-weighted RSI. MFI starts with the typical price for each period. Money flow is positive when the typical price rises (buying pressure) and negative when the typical price declines (selling pressure). A ratio of positive and negative money flow is then plugged into an RSI formula to create an oscillator that moves between zero and one hundred. As a momentum oscillator tied to volume, the Money Flow Index (MFI) is best suited to identify reversals and price extremes with a variety of signals."
"The Money Flow Index is a rather unique indicator that combines momentum and volume with an RSI formula. RSI momentum generally favors the bulls when the indicator is above 50 and the bears when below 50. Even though MFI is considered a volume-weighted RSI, using the centerline to determine a bullish or bearish bias does not work as well. Instead, MFI is better suited to identify potential reversals with overbought/oversold levels, bullish/bearish divergences and bullish/bearish failure swings (emphasis added). As with all indicators, MFI should not be used by itself. A pure momentum oscillator, such as RSI, or pattern analysis can be combined with MFI to increase signal robustness."
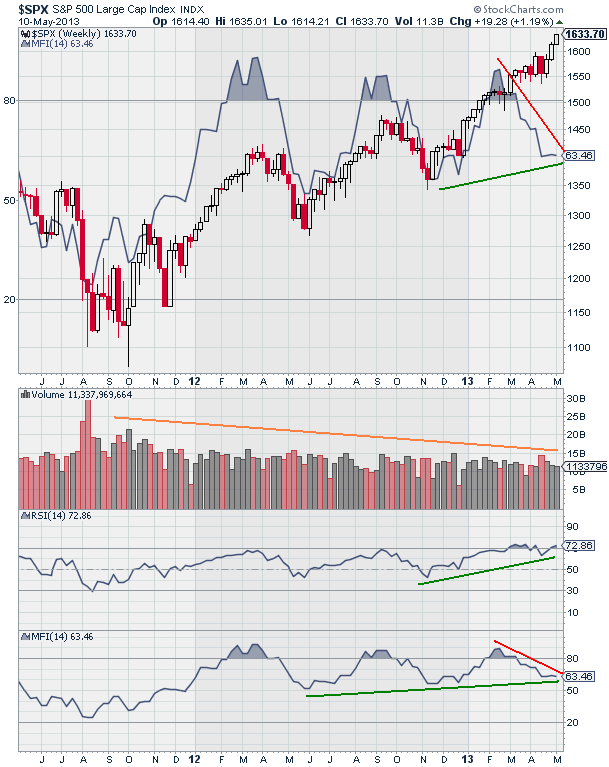
As the below charts display, the weekly chart of the market and the MFI are showing divergence. A weekly time period is used in order to smooth out the potential day to day market variations. On the daily chart, the MFI trend is positive; however, the index recently rose above the overbought area of 80 on the chart. Also, market volume has been in a steady decline since late 2011 and has not picked up in spite of positive equity fund flows as noted in the first chart in this post.
 |
| From The Blog of HORAN Capital Advisors |
 |
| From The Blog of HORAN Capital Advisors |
As with any indicator, no single one is the perfect market predictor. As an example, the Accumulation Distribution Line (ADL) is in a very bullish pattern and is based on the money flow concept as well. As the ADL definition notes, this indicator has given off false signals as well.
At HORAN, we do remain positive on the market, but believe some consolidation could occur and would be healthy for the performance potential through the balance of the year. Our focus has been to reduce or sell some of the holdings in the defensive sectors and build or add to positions in the more cyclically exposed sectors that have underperformed this year, and over the last year for that matter. One stock we trimmed recently was Johnson & Johnson (JNJ). We trimmed the holding for more than technical reasons, but looking at the chart with the MFI overlay, it does show some potential stock weakness ahead when looking at just the MFI.


No comments :
Post a Comment