Monday, June 29, 2015

Equity Put/Call Ratio Jumps To Near 1.0

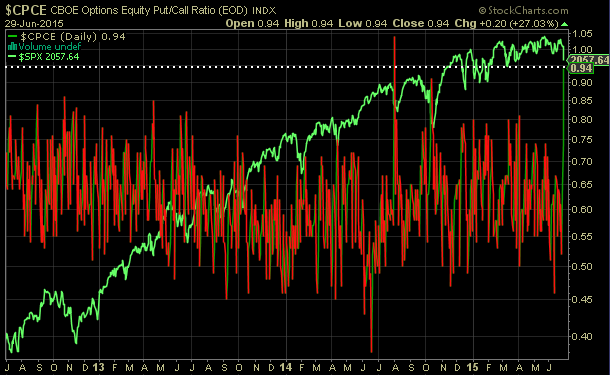
It seems as though the Greece situation has been one that has been ongoing for years and was the cause for today's market decline and jump in the equity put/call ratio to .94 from .54 on Friday. As we noted in a May post in 2012, a spike in the put/call ratio to .99 was partly caused by "the lack of confidence in Europe handling its sovereign debt issues." Nearly three years later the same issues are again challenging investors. For investors, the equity put/call ratio...:
...measures the sentiment of the individual investor by dividing put volume by call volume. At the extremes, this particular measure is a contrarian one; hence, P/C ratios above 1.0 signal overly bearish sentiment from the individual investor.
From The Blog of HORAN Capital Advisors

When countries live and spend beyond their means, an unlimited supply of funding eventually drys up. The contagion concern is associated with countries like Spain, Portugal and Italy. In the U.S. Puerto Rico has now become an issue and broadly, the U.S. is living far beyond its means which needs to be addressed sooner versus later.

In the near term though, the markets sometimes become disconnected and sentiment does suggest an overly bearish investor when looking at the put/call ratio. Other individual investor sentiment measures also are bearish (AAII bullish sentiment.) Overly pessimistic sentiment indicators are contrarian indicators and are indicative of potential market bounces. 


Sunday, June 28, 2015

Equity Market Performance Around Crisis Events

With Greece headlines dominating news stories over this past weekend, investors might be on edge regarding future equity market returns on Monday and the coming weeks. A number of headlines this evening are using the words plunge and slide as U.S. futures are down less than 1.5%. Yes, much can change before the U.S. markets open Monday morning, but it is the sensational headline that generates reader clicks and article views. I have written several times over the past few years about these shocks to the equity market and how the market damage generally has been short lived, (here and here.)

S&P Dow Jones Indices published a report in September 2013, Shocks & Stocks, that analyzed market shocks and the initial market decline and the time necessary to recover the losses. Included in the report is the below table.

From The Blog of HORAN Capital Advisors

As can be seen in the above table, of the fourteen shock events listed, the average market decline was 5.3% and losses were recovered in an average of 14 days. Several of the losses were much greater than the average and the recovery time period much larger than the average. S&P notes though,
  • "Granted, even though selected events took much longer to play out than the medians would suggest, these extreme situations usually occurred within the confines of a long-term bear market and did not precipitate the initial decline. Examples of these include: 1) Pearl Harbor, 2) President Nixon’s resignation, 3) the terrorist attacks on 9/11, and 4) the collapse of Lehman Brothers. So should history repeat itself, and there is no guarantee it will, unanticipated events that occur within bull markets that throw markets for a loop are typically assessed for their economic impact in short order, allowing opportunistic traders to step in and quickly push share prices back to break-even and beyond."
A a word of caution for investors wishing to sell stocks early Monday morning, remember, these crisis events generally have a short lived impact on the return in equity indices.


Thursday, June 25, 2015

Companies Continue To Enhance Earnings Per Share Via Stock Buybacks

S&P Dow Jones Indices released first quarter 2015 buyback detail for the S&P 500 Index. On a year over year basis, buybacks declined 9.5%. In conjunction with the YOY decline in buybacks, YOY operating earnings declined 6.3% and as reported earnings declined nearly 13%. Important in the buyback report is the fact 20% of S&P 500 companies reduced their share count by at least 4%. This share count reduction enhances reported earnings per share and investors need to be aware of the artificial growth in EPS that results from this activity.
From The Blog of HORAN Capital Advisors


Saturday, June 20, 2015

Better Investing Members' Most Active Stocks As Of June 20, 2015

Better Investing Magazine maintains a list of most active stocks as reported by their members. From time to time I highlight recent activity. Below is the list of most active stocks as of June 20, 2015. Most of the active stocks on the list are experiencing more buying than selling. Two issues, Qualcomm (QCOM) and Ford (F), are experiencing the most selling pressure as reported by BI's members.

From The Blog of HORAN Capital Advisors


Disclosure: firm zand family long AAPL, QCOM


EURO STOXX 50 VIX At Record Wide Spread Versus S&P 500 VIX

The VIX index is a measure of volatility and a higher VIX reading is associated heightened investor fear. Because this index is know as the fear index, a higher VIX reading is viewed as a contrarian indicator. In late 2008 the VIX hit a level of near 90% as compared to today's reading of about 14%. Shortly after this high reading the S&P 500 Index reached a bottom and has been on a march higher since.

VIX measures are available for other markets outside the U.S. and one getting some attention at the moment is the EURO STOXX 50 VIX. As the below chart shows the VIX for the EURO STOXX Index has widened to a historically wide level versus the S&P VIX. This widening is likely the result of concern around the consequences of the resolution of the issues in Greece issues and the potential impact on European markets.

From The Blog of HORAN Capital Advisors

As can be seen in the above chart, the average spread between the VIX and EURO STOXX VIX is 3.78% and the current spread is 14.95%. The current reading places this spread difference in the 99 percentile over the last ten years.

For investors then, the question becomes how this spread differential gets resolved. Is the ultimate resolution in Greece a "kick the can" one which is likely viewed favorably by the market or is the future path one where Greece is removed from the Euro Zone? Can Hui, CFA wrote an insightful article covering potential outcomes for Greece and how investors can take advantage of the results in an article titled, Two ways to Play Greece. One important distinction for readers in the article is the two ways to play the Greece situation depends on whether one is a trader or an investor. 


Tuesday, June 16, 2015

Stock Investors Should Hope 2015 Is A Repeat Of 2013

Market similarities comparing this year to 2013 are beginning to rise to the forefront of investors' minds. For equity investors, let's hope 2015 is a repeat of 2013. In 2013 the bond market experienced a "taper tantrum" as the Fed was preparing to end its quantitative easing programs. From early May 2013 to mid September the 10 year US Treasury yield rose from 1.7% to 2.9%. On an absolute basis, this is a significant rise in interest rates and caused bonds to selloff.. The iShares 20+ Year Treasury Bond ETF (TLT) fell over 17% from May 2013 to year end 2013.


Sunday, June 14, 2015

Dow Theory Has Many False Signals

One technical market indicator that has gained quite a bit of focus recently is the weakness in the transport index (IYT) relative to the Dow Jones Industrials Index (DJIA). Dow Theory suggests that underperformance in the transportation sector of the market is a precursor to broader weakness in the Dow index.

From The Blog of HORAN Capital Advisors


Saturday, June 13, 2015

Low Bullish Investor Sentiment Generally Leads To Strong Forward Returns For Stocks

This past week the American Association of Individual Investors reported bullish investor sentiment declined over seven percentage points to 20.04%. This is the lowest sentiment reading level since April 11, 2013 when bullish sentiment was reported at 19.31%.

From The Blog of HORAN Capital Advisors
Data source: AAII


Monday, June 08, 2015

High Quality Stocks Hold Up Better In Broad Equity Market Corrections

Just two weeks ago I wrote an article focusing on investment risk and market corrections, Incurring Investment Risk Near A Market Correction. The "correction" thinking seems to remain high on many investors' and strategists' minds. From a contrarian perspective, market corrections are difficult to time and corrections rarely occur when everyone expects them to. This article is falling into the same line of correction thinking, maybe a trap of sorts; however, the following thoughts will touch on an equity strategy that historically has held up better in declining equity market environments.