Saturday, November 28, 2015

Gold And The Equity Markets

Gold prices have not been immune to the broader issues facing the overall commodity market. Year to date, the price of gold is down 10.8% while the broader CRB Commodity Index is down 20.3%. A part of the issue negatively impacting the price of gold is output is outpacing demand. With the decline in the price of gold the cost to extract gold exceeds the market price in many cases.

From The Blog of HORAN Capital Advisors

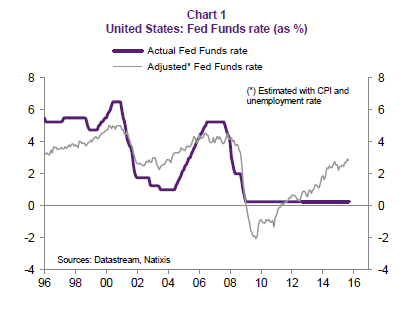
More importantly though, gold is mostly transacted in US Dollars and the strength in the Dollar is a headwind for the price of the metal. The light blue line in the below chart represents the trade weighted Dollar Index compared with gold prices (yellow line). The lines show gold price weakness as the Dollar strengthens. Gold has a negative .65 correlation to the trade weighted Dollar index. With the Federal Reserve nearing lift off for U.S. rates, additional Dollar strength will likely be an outcome into 2016.

From The Blog of HORAN Capital Advisors

Additionally, the red line in the above chart shows the ratio of the S&P 500 Index to the price of gold. This ratio has a positive correlation to the trade weighted dollar and is partly a result of weaker gold prices as the Dollar rises. Another important factor that contributes to the upward sloping red ratio line is a rising S&P 500 Index. The obvious factor that contributes to higher equity prices is the growth in earnings and therein lies the issue for equity prices. As the below chart shows, earnings growth for the S&P 500 Index will be negative for two successive quarters if earnings are negative for the fourth quarter. This would be the first back to back quarterly earnings decline since 2009. The second chart below shows 12-month forward earnings estimates for the S&P 500 Index and the negative growth expectations are weighing negatively on recent S&P 500 returns.

From The Blog of HORAN Capital Advisors

From The Blog of HORAN Capital Advisors

A large part of the earnings weakness is being attributed to the stronger Dollar and its negative impact on multi national companies as they convert foreign earnings back to the Dollar and the negative earnings issues impacting much of the energy sector. As the calendar rolls into 2016, both the currency and energy comparisons should be less of a headwind on a year over year basis.

Absent some type of shock or fear event, gold prices, like many commodities, are likely to remain pressured due to a stronger Dollar and an excess gold supply. For the S&P 500 Index, and equities broadly, a resumption of earnings growth going into 2016 will be necessary for equities to move higher. 


Friday, November 27, 2015

Replacing Federal Reserve Rate Decisions With A Mathematical Formula?

Natixis Global Asset Management recently published a white paper, Can the Federal Reserve Be Replaced by a Mathematical Formula?, highlighting the Fed Oversight Reform and Modernization act approved by the Financial Services Committee of the House of Representatives. This Act would require the Fed to establish a mathematical formula in setting interest rate policy. Not surprisingly, the Fed is not in favor of this type of proposal.

Several highlights in the Natixis paper:
  • The positive side is that it could force the Federal Reserve to monitor developments that it has completely overlooked in the past: credit, asset prices, liquidity, external deficit; it would then need a more complex formula than a Taylor rule;
  • One negative side is obviously that a mathematical formula cannot take into account the complexity of an economic situation: dozens of variables would have to be included (real growth, labour costs, longterm interest rates, savings rate, detailed situation of the labour and real estate markets, etc.);
  • Another negative side is that in contemporary economies, central banks have - and will probably increasingly have - instruments other than the short-term interest rate: purchases and sales of financial assets (bonds, ABS), quantitative easing when interest rates become zero, banks’ prudential ratios, etc. Should each instrument be determined by a mathematical formula?
  • This plan will in all likelihood be abandoned. However, we should not forget that the Federal Reserve’s choices, not guided by a mathematical formula, have quite often been catastrophic over the past 20 years (by accepting asset price bubbles, external deficits, excessive debt levels, etc.). Automating these choices would not have only drawbacks.
The Taylor Rule is one mathematical formula that gets attention and is used by some to determine what the Fed Funds rate should be. The Taylor Rule looks at inflation and employment levels, which today suggests the Fed Funds rate should be near 3%.

From The Blog of HORAN Capital Advisors

The paper notes that today the Fed uses other monetary tools other than adjustments to short term interest rates:
"purchases or sales of financial assets, generally as part of a quantitative easing programme; in the future, increasingly, banks’ prudential ratios (capital ratios, required reserves, etc.). This makes it possible to markedly increase the effectiveness of monetary policy compared with a situation where only the short-term interest rate is controlled, especially by also controlling long-term interest rates"
By not using a formula and,
"By freely setting monetary policy over the past 20 years without being constrained by the use of a mathematical formula, the Federal Reserve has let the following appear:
  • A huge US external deficit from 2002 to 2008;
  • Recurrently, excessive private-sector debt levels;
  • Asset price bubbles;
  • Useless excess liquidity.
"A more complex mathematical formula than a Taylor rule could have forced the Federal Reserve to react to these developments and to not let excessive indebtedness and asset price bubbles develop, which led to the subsequent financial and banking crises."
One conclusion from the white paper notes a formula alone may not serve as the only solution; however,
"But we should not forget that a complex formula that takes into account credit, asset prices, external deficits, etc. would prevent the errors of judgement and monetary policy choices that for the last 20 years have led to - particularly in the United States - crises linked to excessive indebtedness and bursting asset price bubbles."

Source:

Can the Federal Reserve be replaced by a mathematical formula?
Natixis Global Asset Management
By: Patrick Artus
November 27, 2015


Thursday, November 26, 2015

E-Commerce Sales Growth Challenging Traditional Retailers

Brick and mortar retailers continue to face the challenge brought about by the continued growth in e-commerce sales. As the below chart shows, e-commerce sales as a percentage of total retail sales has grown to 7.4% from just under 3% at the beginning of 2006. From a growth perspective, year over year growth in e-commerce sales remains steady at over 15%. 

From The Blog of HORAN Capital Advisors


Wednesday, November 25, 2015

Thankful For The Market Action So Far In 2015

In the spirit of Thanksgiving, investors and readers can be thankful the market has weathered the news headlines headwinds coming out of Europe and the Middle East. Looking at the positives and not sweating the small stuff can certainly make for a happier investor. A recent opinion article in the New York Times, Choose to Be Grateful. It Will Make You Happier, touches on this issue.

The S&P 500 Index ended the pre-Thanksgiving Holiday trading day essentially unchanged, closing at 2,088.87. This unchanged outcome is what the market has delivered to investors for most of the eleven months of the year. As the below chart shows, the S&P 500 Index has been stuck in a 6% trading range (maroon box) except for the decline between August and September. This August and September period resulted in the market contracting 12.3% from its May high to the August low. The quick recovery from the double bottom reached in September has simply taken the market back into its year long trading range. On a price only basis, the S&P 500 Index is up just under 2% so far in 2015.

From The Blog of HORAN Capital Advisors

As investors return to the market following the Thanksgiving Holiday, they will face the uncertainty surrounding the Fed's rate decision in mid December. Until then though, the market's trading range may persist until the rate uncertainty is resolved.


Saturday, November 21, 2015

Better Investing Most Active As Of November 21, 2015

Periodically I detail the most active stocks reported by Better Investing members. Apple (AAPL) continues to be a favorite of Better Investing members, while Qualcomm (QCOM) is the only stock in the top 10 that is showing greater selling interest versus buying interest. New to the list since I list provided an update in August is Under Armour (UA), Visa (V) and Johnson & Johnson (JNJ). Dropping off the list is Southwest Airlines (LUV), General Electric (GE) and Ambarella (AMBA).

From The Blog of HORAN Capital Advisors


Disclosure: Firm or Family Long: AAPL, QCOM, SWKS, JNJ


Thursday, November 19, 2015

Bullish Investor Sentiment Takes A Hit

Today's Sentiment Survey release by the American Association of Individual Investors saw bullish investor sentiment fall 3.5 percentage points. This follows a decline in bullish sentiment of 4.7 percentage points in the prior week. Also, during this two week period, bearish sentiment has increased from 18.6% to 38.68% this week.

From The Blog of HORAN Capital Advisors
Source: AAII

The individual investor sentiment indicator is a contrarian one and is most predictive at its extremes. Bullish sentiment readings near 20% are generally associated with an oversold market. As we noted in our post this morning regarding potential near term market technical headwinds, if a pullback ensues, bullish sentiment is likely to decline further. If this does occur, this could position the market for a rally into year end.


Market Potentially Facing Near Term Technical Headwinds

After the S&P 500 Index pullback on Thursday and Friday last week, the market's advance on Monday and Wednesday has taken the S&P back into positive territory for November. This is impressive given the 8% gain in October. With this month and a half recovery though, the market seems to be facing some technical headwinds.

Of particular interest is the fact the Onbalance Volume Indicator (OBV) has been trending lower this year. Even with the positive market returns the past six week, the OBV is not suggesting conviction on up market days. The OBV indicator measures buying and selling pressure as a cumulative indicator adding volume on up days and subtracting volume on down days. The OBV measures positive and negative volume flow and the trend of the indicator is what is important. A downward sloping trend indicates more volume on down market days versus up market days. As the below chart shows, the OBV indicator is firmly in a downtrend.

From The Blog of HORAN Capital Advisors

Also, as noted in a number of posts in the past, computer algorithms are having a greater influence on the market. These computer algorithms need to trade on specific patterns which are created by price points traced out by the patterns themselves. As the below weekly chart of the S&P 500 shows, one pattern that remains in play is the inverse head and shoulders pattern. The potential downside price target for this pattern is S&P 1,599.

From The Blog of HORAN Capital Advisors

As we noted in our post last week, the high level of the equity put/call ratio was suggestive of a market bounce which investors have enjoyed this week just as the elevated VIX at the beginning of September was a technical indication of a potential market recovery from the ultimate low reached in August. However, as can be seen in the below chart, the VIX has fallen back into the high teens and may indicate a market that is becoming a little too complacent. The OBV certainly is suggestive of a potentially skittish investor as more volume is trading on the down days versus the up days and the right shoulder of the H&S patterns is becoming more distinctive. The market's recovery this week has provided some short term positive support; however, this head and shoulder pattern above remains in play.

From The Blog of HORAN Capital Advisors


Sunday, November 15, 2015

Low Bond Yields Heighten Bond Return Risk When Rates Rise

Although the rate of interest currently paid on high quality bonds today is at levels last seen in the early 1950's, investors generally allocate a portion of their investment portfolio to bonds. One reason for having a portion of an investment portfolio in bonds is the fact bonds tend to hold up well when equity prices decline. Proof of this can be seen in the below chart comparing various stock returns to different bond category returns during the financial crisis. During the worst of the financial crisis that began in October 2007, U.S. stocks fell 56.8% while the Barclay's Aggregate Bond Index and Barclay's U.S. Treasury Bond Index were up 7.2% and 15.4% respectively.
From The Blog of HORAN Capital Advisors
Source: Vanguard

One near certainty is the Fed will increase interest at some point with it simply a question of when not if. When interest rates are moved higher (some believe a December liftoff), bond prices will decline and bond investors may be in for a bit of a surprise. A unique characteristic facing investors today is the rate of interest paid on high quality bonds is at extremely low levels. Historically, bond investors obtained some support when rates increased due to the income support provided by bonds. The below chart from Nuveen highlights the high percentage contribution to return that income has provided to overall bond returns since the end of the financial crisis and since 1976.

From The Blog of HORAN Capital Advisors
Source: Nuveen

The below table from Vanguard is maybe a bit dramatic, but the table shows the impact on a bond's price return given a three percentage point increase in interest rates. One takeaway from the table is the amount of time it takes to recover the principal loss through the interest payment: over three years. This extended recovery is a result of the low interest rate starting point, 2.1% in the example and not far from today's rate.

From The Blog of HORAN Capital Advisors
Source: Vanguard

T. Rowe Price recently opined on this same issue in a recent report. The firm notes,
"Rising rates generally result in principal declines in bond securities, and that risk is exacerbated with rates so low because investors have less of a yield cushion to offset price declines. Overall, though, the firm concluded that "since 1979, bonds have generally not done well during tightening cycles." In fact, that has been the pattern in every tightening cycle since 1963." 
"In the last Fed tightening cycle from 2004–2006, when the Fed rate increased from a multi-decade low of 1.00% to 5.25%, longer-term yields barely budged. This cycle, T. Rowe Price managers expect the bulk of future rate increases to unfold in the short- to intermediate term bond sectors, causing a flattening in the Treasury yield curve (with short term rates rising more than long rates). 'I expect rates to stay fairly low even after the Fed starts raising them,' Mr. Huber says. 'Longer-term rates should stay under control because they are driven by inflation and global growth expectations, which are very modest.'" 
Mr. McGuirk adds, "We don’t see any big move in long rates, and with the Fed moving gradually, you have a long time to earn the extra income to offset any principal loss."
One way to shorten the time period it takes to recover the principal loss is to invest in bond's with higher coupon yields. However, given the extended length of time the Fed has kept rates at the near zero level, higher yielding bond supply is down significantly. As can be seen in the below chart, the percent of bonds that yield more than 4% is far below what was available prior to the onset of the financial crisis.

From The Blog of HORAN Capital Advisors
Source: Blackrock

For investors, the low level of interest rates does pose a potentially higher risk to overall bond returns when the Fed does commence with a higher rate policy. The silver lining is the fact the Fed is most likely to move slowly while pushing rates higher and in small increments. A low trajectory in the rate increases reduces the downside that results from a decline in a bond's price. And lastly, as noted in the above T. Rowe Price highlight, with the low level of inflation and slow global economic growth, the longer end of the interest rate curve may increase at a much lower pace than the short end. And it is long term bonds that can experience the largest price declines when rates rise.


Saturday, November 14, 2015

Narrow Market Breadth And Companies With Negative Earnings Are Leading

Although this past week took the S&P 500 Index return for the year into negative territory (down 3.2%) any positive stock returns have been led by only a handful of stocks. For the week, the S&P 500 Index declined 3.7% and was the first weekly decline after six weekly gains.

From The Blog of HORAN Capital Advisors

As a recent Goldman Sachs report notes,
"five S&P 500 firms – Amazon (AMZN), Google (GOOGL), Microsoft (MSFT), Facebook (FB), and General Electric (GE) – account for more than 100% of the index total return YTD prompting client inquiries regarding narrow market breadth. The Goldman Sachs Breadth Index currently equals 1, one of the lowest readings in the 30-year series. Our index has experienced only 11 narrow breadth periods since 1985, including three during the late 1990s that share several characteristics with the current narrow breadth episode. The typical episode lasted 4 months and strong balance sheet, mega-cap, and high momentum were factors that outperformed. The current period is one month old and may last into early 2016."
In addition to the narrow leadership in the large cap space, T. Rowe Price notes small cap stocks without any earnings have been outperforming those companies that have earnings as represented by stocks in the small cap Russell 2000 Index.

From The Blog of HORAN Capital Advisors

This narrow market leadership along with the outperformance of companies with no earnings has contributed to some of the market's recent volatility. Additionally, the recent volatility is playing a part in the spike in bearish sentiment. As can be seen in the below chart, the CBOE equity put/call ratio jumped to .98 as of Friday's market close.

From The Blog of HORAN Capital Advisors

As noted in prior posts, put/call ratio readings above 1.0 are most predictive of overly bearish sentiment and is indicative of a market that has the propensity to rally.


Sunday, November 08, 2015

Social Security Benefit Increases Do Not Keep Pace With Retiree Costs

Many retirees receiving a social security benefit know their monthly benefit will not receive a cost of living adjustment in 2016. This is the third time in the last six years where social security benefits did not increase due to the low inflation environment. ICMA-RC recently compared the growth in social security benefits to the growth in some standard costs faced by retirees. As the below chart shows, some of the basic costs retirees face have far outpaced the growth of their social security benefit.

From The Blog of HORAN Capital Advisors
Source: ICMA-RC

As noted in the ICMA-RC article, it is important retirees, and really future retirees, do not put themselves in a situation where social security is their only source of retirement income. Further, retiree investment funds should be invested in a way that provides the opportunity for the funds to grow in excess of the rate of inflation. Even in a low inflation environment basic costs are likely to increase. Additionally, with the Federal Reserve approaching lift off for the Fed Funds rate, a rate increase can have a negative impact on the performance of interest sensitive investments. In a post we wrote in 2013, Chasing Yield Has A Downside When Interest Rates Rise, we detailed the performance of a few categories of interest sensitive assets during a period of rising interest rates. Some investors believe "yield" investments are safer since they pay interest or a higher dividend. As noted in the previously mentioned article, these yield type investments can generate poor returns when interest rates do rise.


Sunday, November 01, 2015

Market Looks Overbought Short Term, Longer Term Could Be More Promising

Historically, the equity markets have been known to experience some of their largest declines in the month of October. Equity market returns in the just completed October did not fall prey to this statistic though. The S&P 500 Index and the Dow Jones Industrial Average had their best monthly returns in four years, both up by more than 8%.
From The Blog of HORAN Capital Advisors

The recent strong equity market returns have pushed the market into short term over bought territory. However, looking at longer term technical indicators the market and its technicals resemble the October 2011 time period.

First, looking at shorter term technicals, the below daily chart of the S&P 500 Index shows the index's MACD and stochastic indicators have moved into overbought territory. Both indicator levels are similar to levels reached in October 2011. The market return subsequent to 2011 has been resilient.

From The Blog of HORAN Capital Advisors

In comparing the same indicators on a weekly chart though, one can see the October 2015 and October 2011 levels are nearly identical as well with the MACD indicator experiencing a bullish crossover at both dates.

From The Blog of HORAN Capital Advisors

In terms of individual stock movement, the below chart shows nearly 80% of S&P 500 stocks are trading above their 50 day moving average as of Friday's market close. In comparison, at the end of August, only 5% of stocks were trading above their 50 day moving average.

From The Blog of HORAN Capital Advisors

Only 52% of stocks are trading above their respective 150 day moving average. This is certainly an improvement over the 13% level in late August. The current level though remains below prior peaks in the mid 80% range.

From The Blog of HORAN Capital Advisors

Lastly, the 21-day moving average of the equity put/call ratio is now trending lower and stands at .68. Near the end of September, we noted in a post, A Few Positive Equity Market Technicals, that the moving average of the P/C ratio appeared to peak around .79 and was beginning to turn lower. Equity put/call ratios over 1.0 are indicative of oversold markets. By looking at the 21-day moving average of the P/C ratio, a potentially more sustainable trend can be seen. Declines in this ratio are generally associated with a market that trends higher on a forward looking basis.

From The Blog of HORAN Capital Advisors

A significant difference between 2011 and 2015 is the earnings growth of S&P 500 companies. In 2011 operating earnings were growing at a double digit rate. Today, as the market digests third quarter corporate earnings reports, earnings growth is expected to be negative on a year over year basis. Secondly, the Dollar:Euro exchange rate was nearly $1.40 in late 2011 and now the exchange rate is $1.10. This Dollar strength is serving as a headwind for multinational companies. We expect further Dollar strength; however, not of the same magnitude as experienced from 2011 to 2015.

In conclusion, the equity market does appear overbought in the near term. However, in evaluating longer term technical measures, the market appears to want to move higher in spite of the potential for a short term pullback. As we have noted in several recent posts and our most recent Investor Letter, for reasonable equity market returns to be achieved over the next twelve months, a lot will hinge on earnings growth in the fourth quarter and first half of 2016. At worst, the currency headwind should lessen and the consumer should benefit from lower energy prices.