Sunday, March 27, 2016

Different Year But Same Story

The blog, The Fat Pitch, published a great article last week highlighting the issues currently impacting investors, Current Investor Concerns. Following is an excerpt from the article:

The US economy is stuck in one of the most sluggish recoveries in history. Growth is just 2% and it will remain slow as consumers and companies work off vast amounts of debt. The country has gotten off track and neither political party has any answers. 
These sentiments were written in Time in 1992, the year one of the biggest growth eras in American history began. But these same words are often used to describe the current economic environment. 
Not helping matters is the Fed, which appears to have boxed itself into a corner. It's policies have been ineffectual and have created record budget deficits. The consensus is that the Fed has overstayed its course. A new way of handling monetary policy is needed.

The year these words were written is 1982, when America was on the threshold of an 18 year bull market. But central bankers and their policies were as hated then as they are today (from the NYT).

As the author of the article notes in the conclusion, "The story in the stock market is almost always the same: the fundamentals of companies and the economy are weak, but central banks, corporate buybacks and earnings manipulation are keeping share prices artificially afloat."

The entire article is a worthwhile read for investors.


Sunday, March 20, 2016

Equity Market Advance: Actions Speaking Louder Than Words

Near the end of February we noted pessimism was being exhibited by both individual and institutional investors. In addition to this pessimistic view of the market, we noted some economic data was looking more favorable and combined, higher equity prices could result in the weeks ahead. True to form investors took advantage of the market pullback and added to their equity positions and the market has moved higher for five straight weeks. At the time of that post, the NAAIM Exposure Index was reported at 31.65. This past week's exposure index reading came in at 62.72 and notes NAAIM member firms have increased long equity exposure.


Thursday, March 17, 2016

Market Advance Does Not Result In Improved Investor Sentiment

Although the S&P 500 Index has bounced significantly higher from the February lows, the market action seems indicative of one where investors were caught on the sidelines. Even with the move higher in stocks, individual investors are indicating their skepticism about the market advance if we look at AAII's bullish sentiment indicator. Today's release showed bullish investor sentiment was reported at 29.96%, a 7.4 percentage point decline from the prior week. A majority of this point decline showed up in the neutral sentiment category. The net result is a nearly 10 percentage point decline in the bull/bear spread to 3.1%.


With the strong move higher in stocks, as can be seen in the below chart, a number of technical indicators are indicating the market is at least short term over bought. The three technical indicators in the below chart, money flow index, MACD and stochastic indicator, are near or at overbought levels. Interestingly, the death cross triggered in early January and it turned out to be a bullish trigger.


Sunday, March 13, 2016

Dividend Paying Stocks Held Up Better In The Market Downturn

An attractive aspect of owning dividend paying stocks, specifically, dividend growth equities, is the fact they tend to hold up better in down market environments. The favorable result from this characteristic is it takes a smaller upside return to make up the losses incurred in a market decline.


As far back as 2010 I wrote about this favorable feature in a post, Comprehensive Review Of The Dividend Aristocrats. As noted in that article, in shorter time frames, the dividend aristocrats did exhibit a higher standard deviation, yet the total return of the aristocrats was higher than the broader S&P 500 Index and resulted in the aristocrats having a higher Sharpe ratio. A part of this is attributable to the favorable compounding impact of reinvested dividends.

As we fast forward to today and the recent downturn in the equity markets from early last year, the favorable performance of dividend paying stocks is once again evident. For the year to date period both the iShares Select Dividend ETF (DVY) and the SPDR S&P Dividend ETF (SDY) are outperforming the S&P 500 Index as seen in the below chart. During the market pullback from 12/31/2015 through February 11, 2016, the dividend focused ETFs held up significantly better than the S&P 500 Index itself. As the market has recovered, the dividend paying indexes are maintaining their outperformance and have recovered the losses incurred in the pullback.


Saturday, March 12, 2016

Is The Value Style Outperformance Sustainable?

Until the market's (S&P 500 Index) recent rebound from the February 11, 2016 low, investors have essentially gone two years with flat returns in stocks. Certainly it has not been a market that has just traded sideways, but one with significant volatility, both up and down. The most recent recovery has pushed the S&P 500 Index back into the trading range in place since late 2014. Technically, this recent rally into the higher range opens up the potential for the Dow to move to the top of this higher range, 18,300 and the S&P 500, 2,130.


Contributing to the improved equity market since the February bottom has been the strength in value and cyclically oriented sectors: energy, financials and industrials. As the below chart shows, energy is up 15.8%, financials are up 14.4% and industrials are up 11%. These three sectors are more heavily weighted in the value oriented indices like the iShares S&P 500 Value Index (IVE). Financials account for over 25% of the value index versus an 8% weighting in the growth index (IVW). Energy represents 12% of the value index versus only 1% in the growth index.


Monday, March 07, 2016

Oil Price Rise Predicated On Potential OPEC/Russia Output Cuts

Oil prices in the first quarter of this year have turned higher, much like the pattern at the beginning of 2015. Since mid February the price of Brent Crude has increased nearly 40%, climbing from the high $20/bbl level to the high $30/bbl level.


Friday's Commitment of Traders Report (COTR) released by the Commodity Futures Trading Commission (CFTC) noted money managers increased bullish bets on oil to the highest level since November. This increased bet on higher oil prices has occurred in spite of a higher than expected increase in oil inventory. The EIA Petroleum Status Report saw crude inventories rise 10.4 million barrels to a record 518 million barrels of oil inventory. The EIA report noted gasoline inventory declined 1.5 million barrels as demand for gasoline increased a strong 6.9% on a year over year basis. The oil inventory in the below chart includes not only crude oil, but gasoline, distillate fuel oil and all other oil related inventory.


As Reuters reported after the market close on Friday,
"U.S. oil prices rose to the highest since late January and Brent jumped to their highest since early January on Tuesday amid hopes that top global producers will agree a coordinated output freeze. That helped to offset growing concerns about the record U.S. inventory. 
"U.S. crude futures ended the week 10 percent higher after settling 4 percent higher at $35.92 a barrel on Friday as strong U.S. jobs data spurred hopes of better demand growth and on technical buying after crude prices breached resistance levels on charts. 
"The price action was impressive this week. Especially getting through $35 a barrel," said John Kilduff, partner at Again Capital, a New York energy hedge fund."
It appears speculators are counting on production cuts by OPEC and Russia. If these cuts do not materialize, the oil price pattern detailed in the first chart above could result in oil prices falling back below the $30/bbl level as too much supply seems to be the main driver of the recent volatility in oil prices.


Saturday, March 05, 2016

Dogs Of The Dow Continue To Exhibit Strength

Through Friday's (3/4/2016) market close, the average return for the Dogs of the Dow of 2016 continues to outperform both the S&P 500 Index and the Dow Jones Industrial Average Index. The average return through Friday for the Dow Dogs totals 3.5% versus the S&P 500 Index return of -1.7% and the Dow Jones Industrial Average Index return of -1.9%. In 2015, the average return of the 2016 Dow Dogs equaled -9.3%.


Of some note in the above table is the estimated earnings growth rate for the two energy stocks, Exxon and Chevron. This higher anticipated growth is partly possible due to the easier comparison for next year's energy company earnings versus this year's. With the market getting closer to a point where energy is no longer a potential detractor from overall index earnings, a resumption in earnings growth for the overall market is certainly achievable beginning in the second half of the year, all else being equal.


Disclosure: Long VZ, XOM, PFE (family)


Tuesday, March 01, 2016

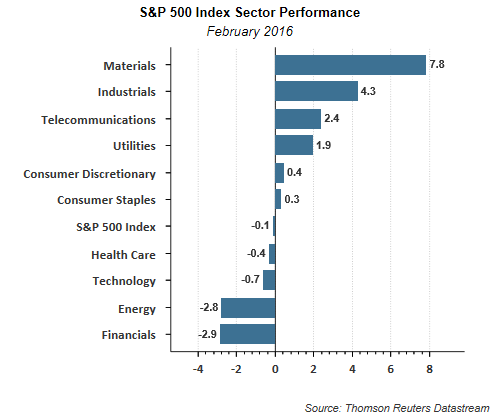
Transports And Cyclical Sectors Leading

The transport index has made a sharp recovery, up nearly 10% since late January. There is some argument that under Dow Theory, a buy signal has been triggered. Jeffrey Saut, of Raymond James, published commentary yesterday, By The Side Of The Road, discussing this Dow Theory buy signal.


In addition to cyclically exposed transports, several of the more cyclical sectors of the S&P 500 Index have displayed leadership in February to, materials and industrials.


For long term investors, missing the handful of strong equity market up days during a given year will penalize return outcomes for the entire year. Some will comment missing those down draft days enhances returns as well, and that is certainly true. Timing when to get in an out of the market though is one difficult endeavor and the long term bias of the market is a trend that moves higher.